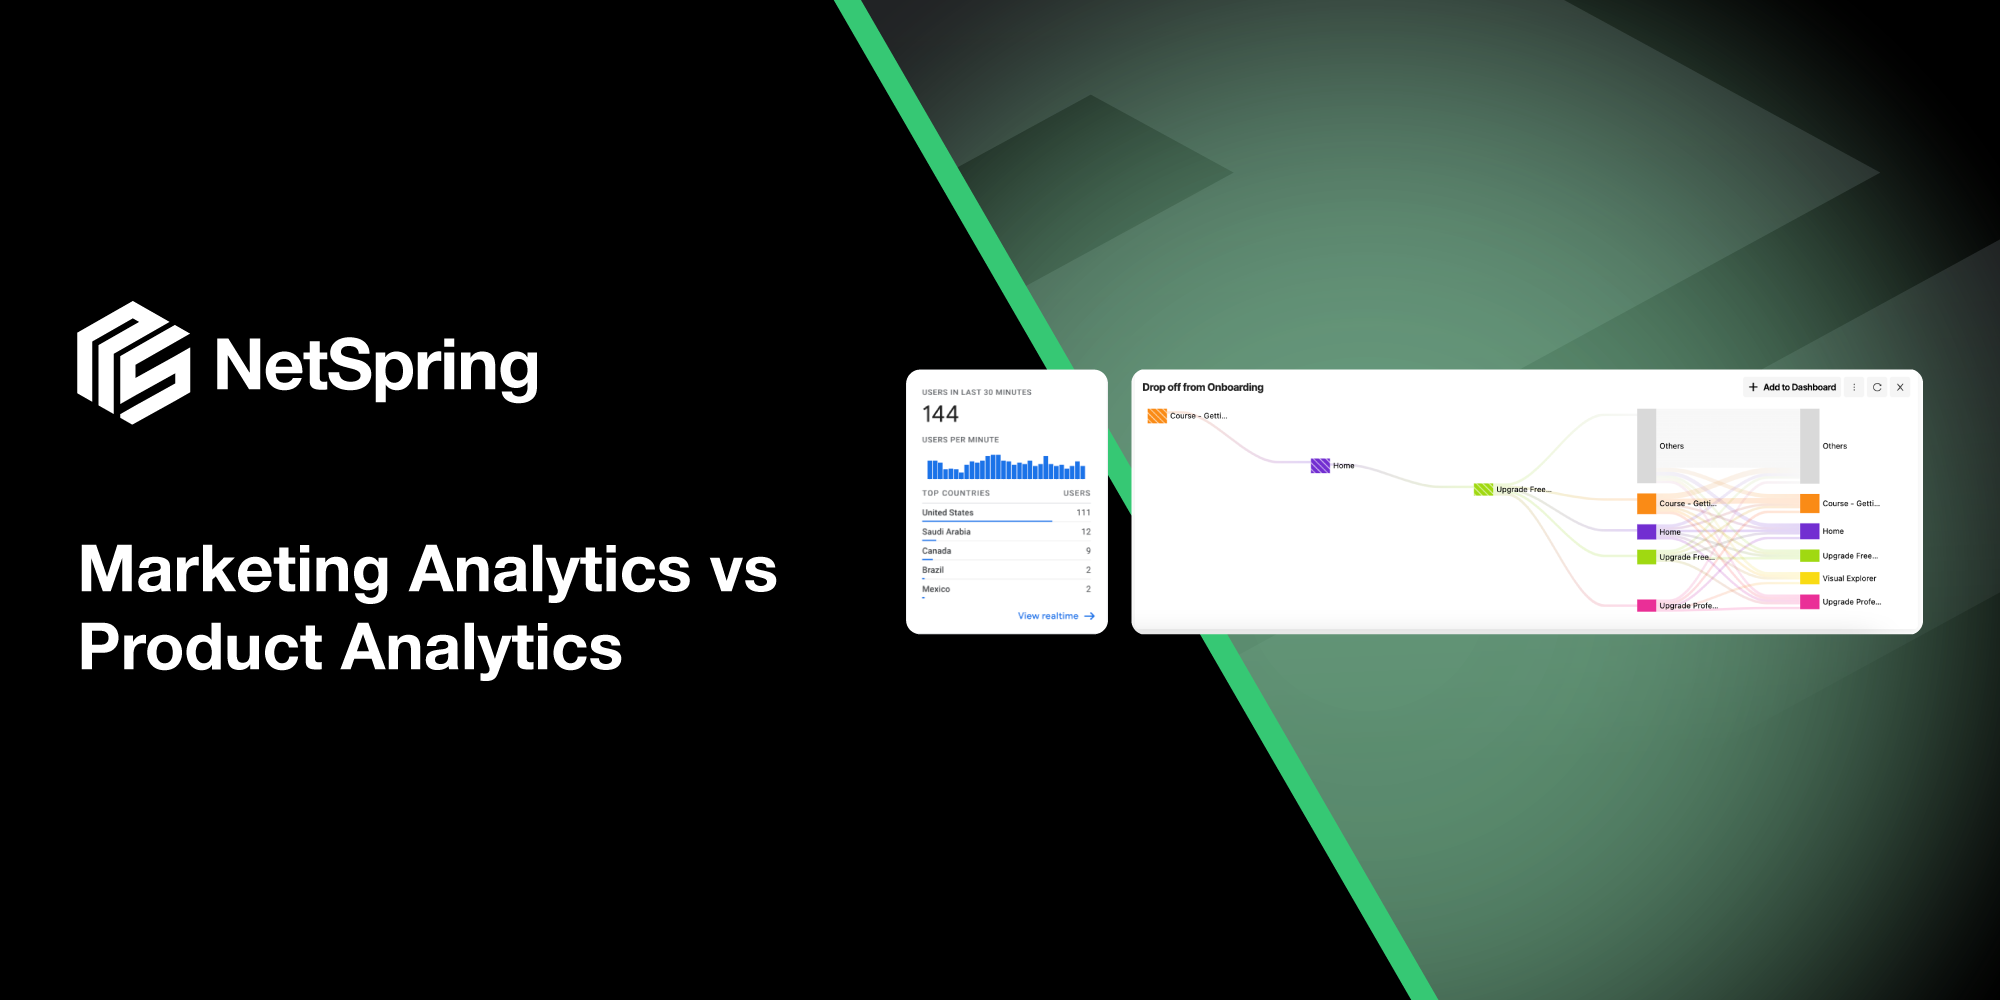
Product analytics vs marketing analytics
Historically, product analytics and marketing analytics have been run separately as distinct processes each with its own focus, users, goals, and tools.
In a fast-moving, product-led-growth-focused environment, that’s rarely the case anymore. Before we get into the overlaps and convergence though, let’s look at what the terms mean and how the difference has generally been understood.
What is product analytics?
Product analytics has traditionally been about understanding how users interact with a product or service, with the goal of improving the user experience. It generally involves tracking user behavior within the product/app/website — including feature usage, user flows, engagement, and retention
By analyzing this data, product and growth teams gain insights into how users are interacting with the product, where they are encountering friction or dropping off, and what features and improvements are most likely to drive engagement and retention.
This means they can make informed decisions about product development and optimization. Product analytics help teams decide on which bugs or usability fixes to prioritize from the product backlog; measure the impact of new features or updates; and predict and prevent user churn
Key goals of product analytics include:
- Improving user engagement and retention
- Identifying areas for product improvement and optimization
- Measuring the impact of new features and product changes
- Understanding user behavior and preferences
- Driving product-led growth
On a day-to-day basis, product teams use the following KPIs to explore their key business questions:
- Daily Active Users (DAU) and Monthly Active Users (MAU) — How many users are actively engaging with the product on a daily and monthly basis?
- Feature adoption — What percentage of users are adopting and engaging with specific features within the product?
- User retention — What percentage of users continue using the product over time, and how does this vary by user segment?
- User flows — How are users navigating through the product, and where are they encountering friction or dropping off?
- Conversion rates — What percentage of free trial or freemium users are converting to paid customers?
Popular product analytics tools include NetSpring, Mixpanel, Amplitude, and Heap. As we will discuss later, these tools vary significantly in their ability to evolve with the modern data stack and meet changing organizational needs for secure, flexible, warehouse-native analytics.
What is marketing analytics?
Marketing analytics, on the other hand, has historically focused on understanding and optimizing the performance of marketing campaigns and channels, with the goal of acquiring new customers and driving business growth. It involves tracking and analyzing data from marketing touchpoints including website traffic, email campaigns, social media, and paid advertising.
By taking a data-driven approach, organizations can better understand customer behavior, preferences, and purchase patterns — and make their marketing strategies more targeted and effective.
Key goals of marketing analytics include:
- Optimizing marketing spend by ensuring campaigns and channels provide return on investment (ROI)
- Identifying the most effective marketing tactics and messages
- Segmenting audiences for more targeted marketing efforts
- Predicting customer behavior and forecast marketing outcomes
- Understanding customer acquisition costs and lifetime value
Marketing teams generally use the following metrics and questions to get the information they need:
- Customer Acquisition Cost (CAC) —How much does it cost to acquire a new customer through various marketing channels?
- Website Traffic and Engagement Metrics —How many visitors does our website attract, and are they engaging with our content and staying on the site or bouncing?
- Conversion Rate —What percentage of website visitors or leads make a purchase or take desired actions (form submissions, demo requests, free trial signups)?
- Social Media Metrics —Are we gaining followers, receiving likes, comments, and reshares, and driving conversions or traffic?
- Return on Ad Spend (ROAS) —How much revenue is generated for each dollar spent on advertising?
- Customer Lifetime Value (CLTV) —How much revenue does a customer generate over the course of their relationship with the company?
A typical martech stack includes tools like Google Analytics, Adobe Analytics, and HubSpot. However, future-focused marketing teams are increasingly moving toward more holistic product and customer journey analytics, whether that’s through business intelligence (BI) tools like Looker and Tableau, product analytics tools like Amplitude and Mixpanel, or next-generation warehouse-native product and customer journey analytics tools like NetSpring.
From silos to synergy: Holistic product and marketing analytics
Modern warehouse-native customer analytics platforms like NetSpring break down product and marketing analytics silos, helping teams to visualize the full customer journey and easily run ad-hoc analysis to get specific data-driven insights.
So why have these silos been the norm for so long in the first place?
Let’s take a quick look at how analytics tools, and the data models they work off, developed.
The evolution of product analytics and marketing analytics tools
Traditional business intelligence (BI) tools, such as Looker and Tableau, emerged to meet the needs of data-driven organizations, providing powerful analytics from ERP, CRM, and HCM data stored in the warehouse.
However, these tools aren’t ideal for product analytics as:
- They aren’t designed to express or compute event-oriented analytics
- They require specialized data teams or professionals running complex SQL to get behavioral analyses, which creates bottlenecks and slows down access to data.
Enter: purpose-built product analytics tools like Amplitude, Mixpanel, and Heap, designed to plug the gap and help product teams track and analyze user behavior within their applications. These tools provide product instrumentation and analytics with ready-made templates for event tracking, user segmentation, funnel analysis, cohort analysis, and more.
But these first-generation product analytics tools often produce further silos by vertically integrating capture, storage, and reporting capabilities within their own platforms, limiting the ability to combine data and answer more complex, business-relevant questions. In fact, many teams end up importing this product analytics instrumentation data into the warehouse and using BI or SQL tools to analyze it.
This is far from ideal. Here’s why:
- It leads to data duplication, which is a data governance and security risk
- Analytics get fragmented across multiple tools, which creates inconsistencies and low trust in the numbers
- It requires time-consuming transformation processes
- SQL/BI tools just aren’t optimized for analyzing fast-moving, granular product event data
On the marketing analytics side, tools such as Google Analytics and Adobe Analytics, continue to provide valuable data that helps marketers understand how users interact with their content and identify high-performing acquisition channels. But to adapt to product-led marketing needs, teams will need to complement this data with product analytics insights to get a fuller picture of the customer journey.
The convergence era: Warehouse-native analytics
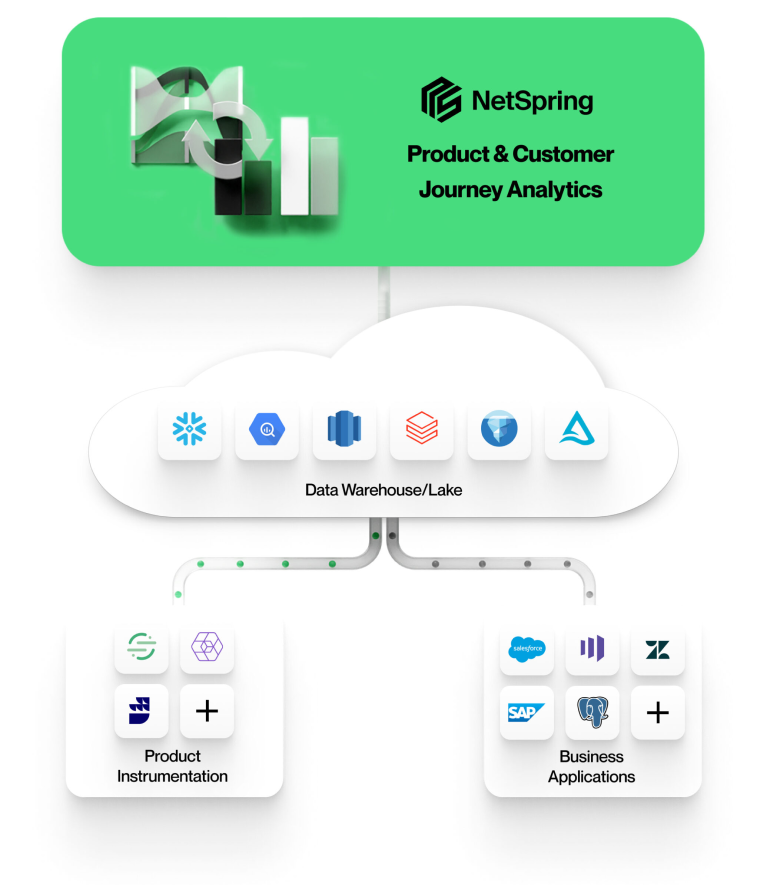
Next-generation product, marketing, and customer analytics brings together product event data with customer business data sourced from CRMs, customer support tools, web analytics, and more
Thankfully, a new era is emerging, driven by major advances in cloud-based data warehousing, composable customer data platforms (CDPs), and best-in-class analytics platforms.
Next-gen analytics tools like NetSpring are built directly on modern data warehouses and composable CDP architectures that consolidate product, marketing, and other customer data into a single source of truth. With powerful self-service data modeling, visualization, and activation pointed directly at the warehouse, these new-era tools break down silos and eliminate the need for data duplication — while slicing and dicing high-velocity relational event streams in a way BI tools can’t. That means high-powered, streamlined, and consistent analytics
Warehouse-native tools go beyond traditional product analytics vs marketing analytics distinctions. In fact, they’re leading the way to the convergence of multiple channels and data sources within the broader category of customer analytics. By drawing on centralized warehouse data, they give teams a view of the entire customer journey across all touchpoints, including great product analytics that incorporate web and marketing interactions, customer support contact, e-commerce interactions, finance/transaction interactions, and more.
Future-focused, next-generation product and marketing analytics
The convergence of marketing and product analytics (and beyond) is key for businesses to truly understand the full customer journey.
NetSpring’s warehouse-native approach integrates the rich modeling and visualization capabilities traditionally associated with business intelligence (BI) tools with easy-to-use product and marketing analytics.
With powerful, flexible data modeling capabilities, NetSpring lets product, marketing, and customer-focused teams run ad-hoc and exploratory analytics. This empowers them to answer complex business questions, spot patterns and opportunities, and quickly adapt to changing market conditions and customer needs.
By leveraging the power of modern data warehouses and composable CDPs, NetSpring breaks down analytics silos and supports companies to connect the dots between each stage of the customer experience.
As the boundaries between product and marketing continue to blur, a holistic, future-focused approach to customer analytics will be the key to staying ahead of the curve and delivering exceptional customer experiences. With NetSpring behind you, you’ll have all the insights you need to bridge the gap between product and marketing analytics and bring your teams together to deliver product-led growth.