As a data-driven organization, you are probably using several analytics tools to address various analytical use cases:
- Business Intelligence (BI) – For reporting on historical business data, working off aggregated transaction data brought into the data warehouse from business systems.
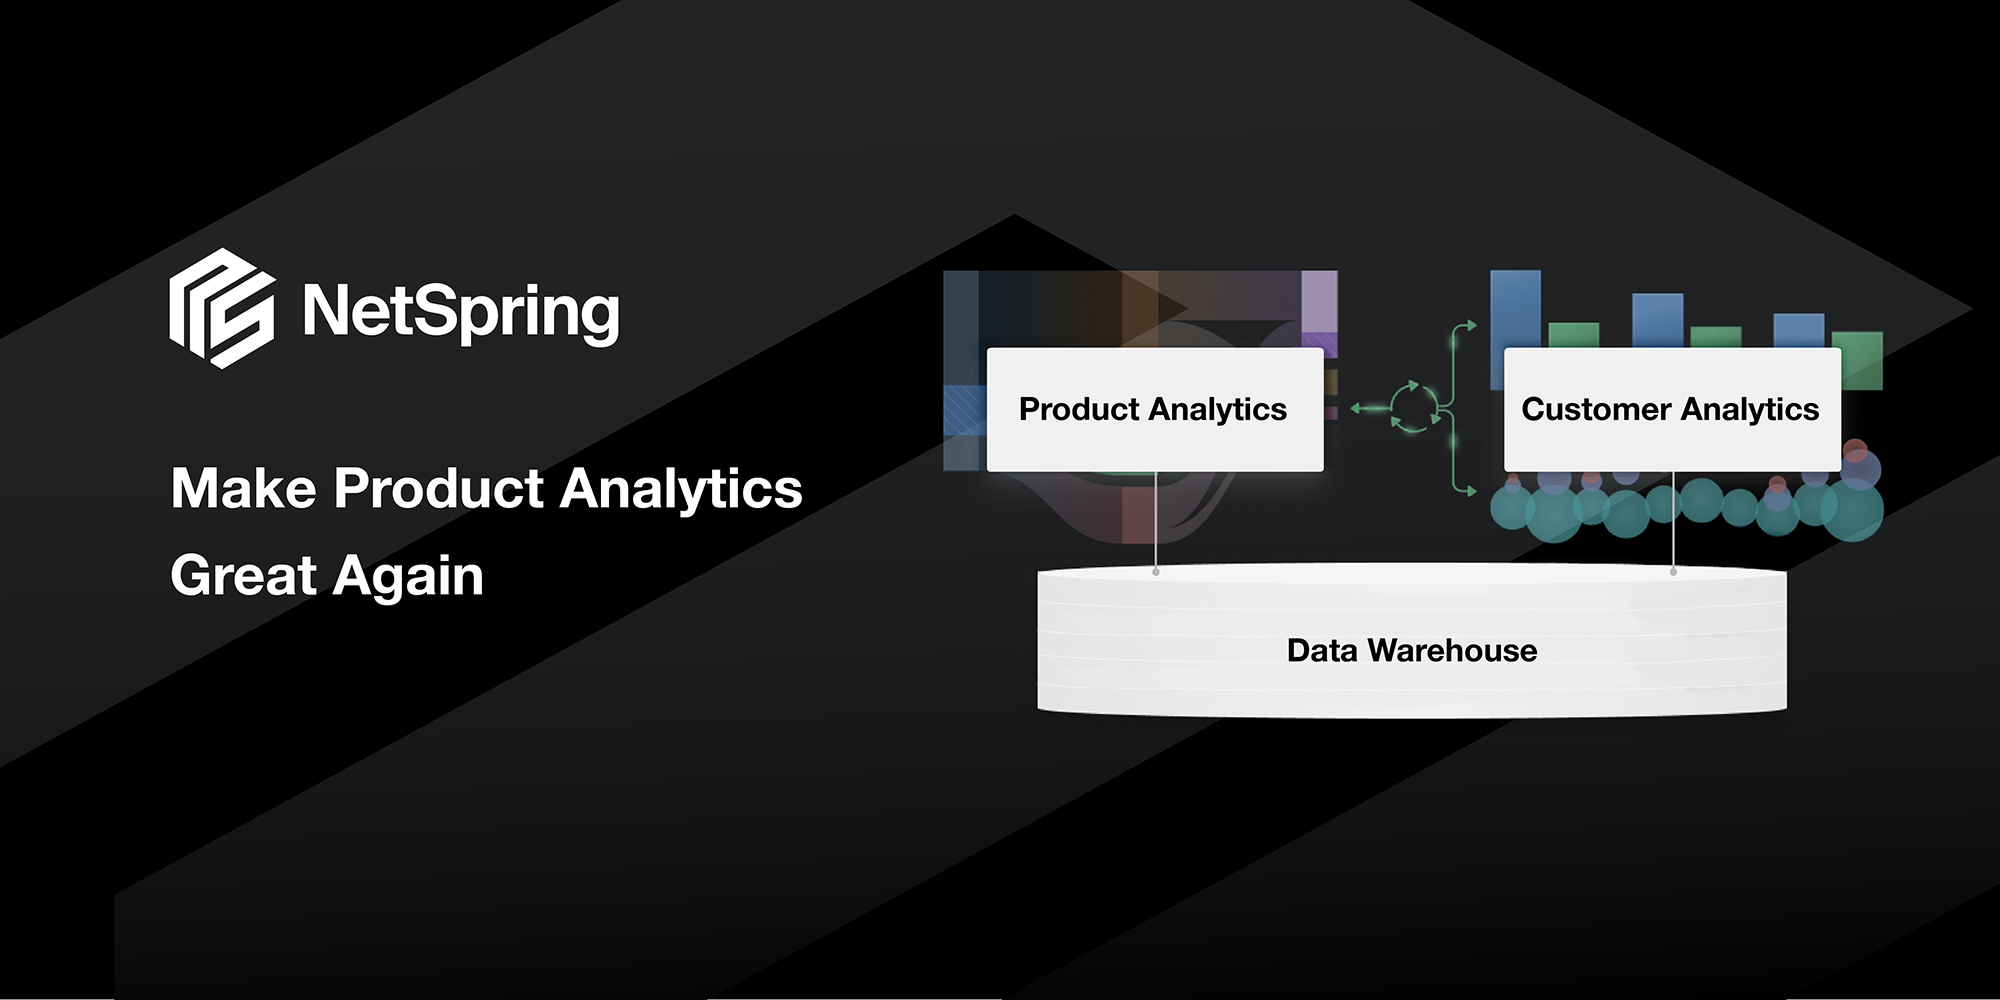
- Product Analytics – For analyzing patterns of product usage and customer behavior from product instrumentation event data, to optimize user experience, conversion, engagement, retention, and growth.
- Infrastructure Monitoring – For real-time monitoring of operational health of systems and applications, by using server, process, and log data.
- Machine Learning (ML) – For analyzing and drawing inferences from patterns in data with AI algorithms and statistical models.
While the last two, Infrastructure Monitoring and Machine Learning (ML) are specialized tools that are likely to remain separate, the lines are blurring between Business Intelligence (BI) and Product Analytics.
The evolution of Product Analytics
Why are the lines between BI and Product Analytics blurring? Historically, product analytics has been focused on analyzing just product instrumentation streams to provide product managers visibility into product usage. First generation tools like Amplitude and Mixpanel have made traditional product analytics mainstream. However, their siloed view has always been very limiting. This is further exacerbated in recent times with PLG-driven motions, where companies want a 360-degree view into their customers – across all channels of interactions, and incorporating context from all business systems. Feeble attempts to address this in first-generation tools with simplistic “reverse ETL” solutions is cumbersome and incomplete.
From Product metrics to Business metrics
Consider a traditional product analytics tool showing you that conversion rates have increased following the release of a new feature. However, what if the majority of customers who converted, ended up canceling by calling your call center? That data is not in the siloed product instrumentation stream that traditional tools work with. It is in a different business system that is inaccessible to first-generation product analytics tools. Similarly, can you understand the impact of a product change on support tickets/calls – data that is in Zendesk? Can you understand product engagement by subscription tier – data that is in Salesforce? Can you be alerted to product friction or increased engagement in accounts whose renewal is coming up in a month – data that is in NetSuite?
Can you break down subscription revenue by cohorts of customers? Can you prioritize product issues based on impact on revenue? Can you target the right set of customers with the right campaigns/offers/nurture based on their lifetime value?
It is no longer sufficient to understand narrowly-defined product metrics based on just product instrumentation data. As modern businesses evolve to product-led growth, Product teams are quickly becoming revenue centers, and need to graduate from product metrics to business metrics, with product instrumentation data being just one source of input. They need a business analytics tool that provides a broader view. They need business analytics to be more impactful and influential with the C-suite.
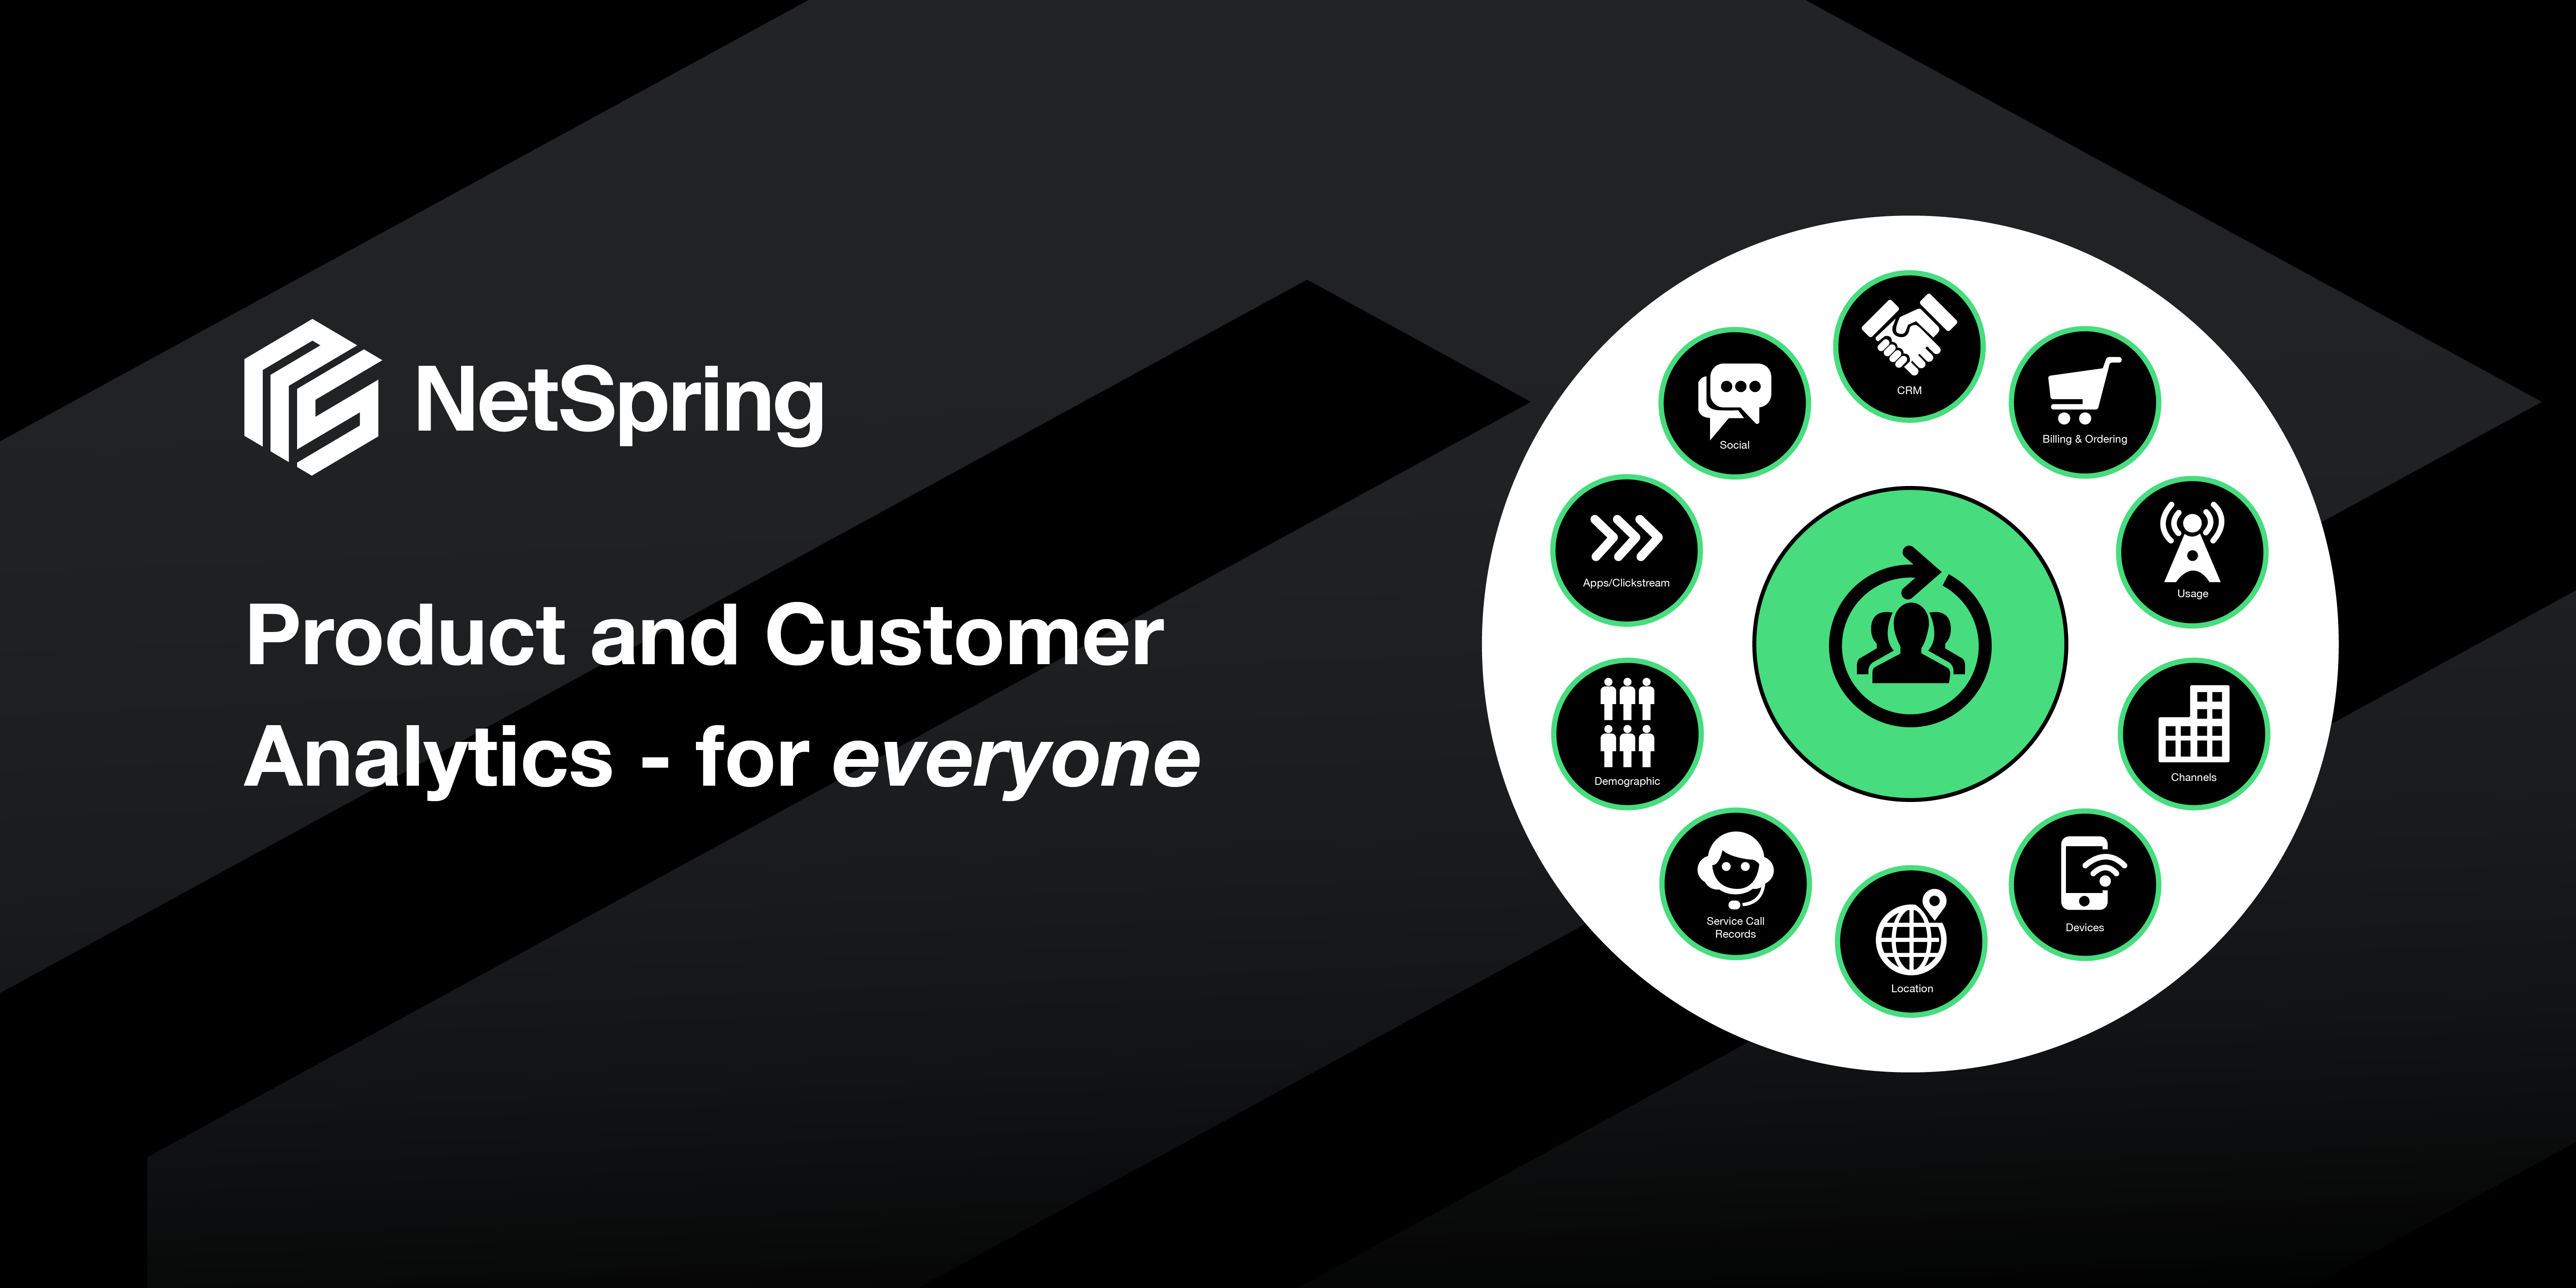
Business Analytics for everyone
Traditional product analytics has primarily served only product managers. But several other teams in modern enterprises need visibility into product usage and customer behavior in the context of their business functions. Business analytics is for everyone in the organization that cares about the product and their customers – Growth Marketing, Customer Success, Sales, and Support. And product managers can benefit too from a broader understanding of the business impact of the product features they work on.
What does a Business Analytics tool look like?
So what does such a Business Analytics tool look like? It starts with classic product analytics, such as event segmentation, retention, funnel, paths, etc. But we are also talking about incorporating data from business systems that typically is reported on in BI tools. We are talking about seamlessly navigating from one to the other. For example, take a cohort of users that dropped off from a particular funnel stage to another, and break them down by various dimensions such as Account, Region, Age etc. The former (funnel) is classic product analytics. The latter (dimensional slice-and-dice) is classic BI.
The challenge today is that these are in separate systems. So when a user in a first-generation product analytics tool has the next level of questions, they have to call their data engineering teams to build them a one-off report in a BI tool. The data engineering team has to export data from the product analytics tool into a data warehouse and write cumbersome SQL to produce the report – this could take weeks. Furthermore, you now have fragmented analytics in two separate systems that cannot be used seamlessly. For example, what if you wanted to create a cohort of users from a BI report and use it to understand journeys those users took in the product? It is practically impossible to do that today.
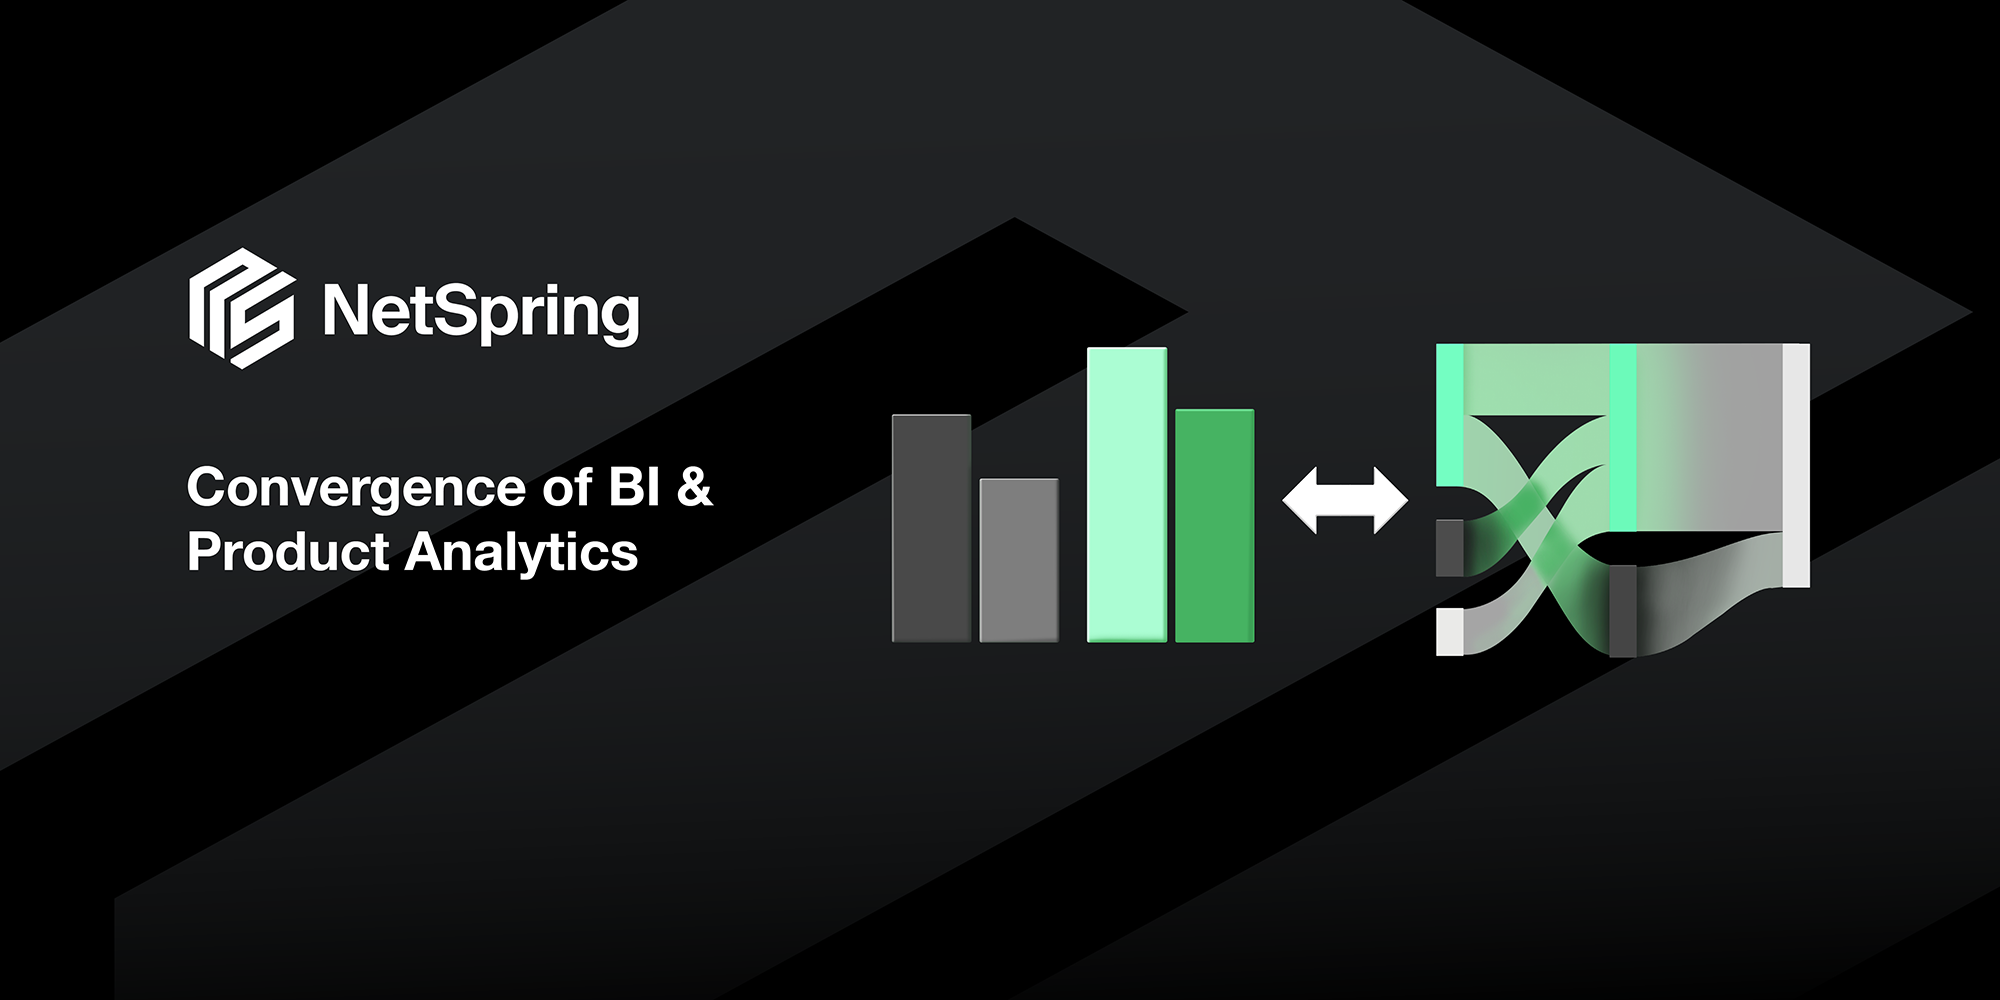
A next-generation business analytics tool is a convergence of traditional product analytics tools and BI tools, in one single platform.
The architectures of BI and Product Analytics tools
Conventional wisdom says that you cannot do product analytics in a BI tool, or BI in a product analytics tool. That was once true.
Traditional product analytics tools today can’t work off a warehouse like BI tools can. They don’t have a generic data modeling or analytical expressibility layer like BI. They are purpose-built for a specific use case and are not generic analytics platforms like BI.
BI tools, on the other hand, are not suitable for expressing event-oriented queries that involve sequences, paths, flows, and time series. Expressing such queries in SQL is extremely cumbersome. Furthermore, the SQL they generate does not perform well for interactive analysis.
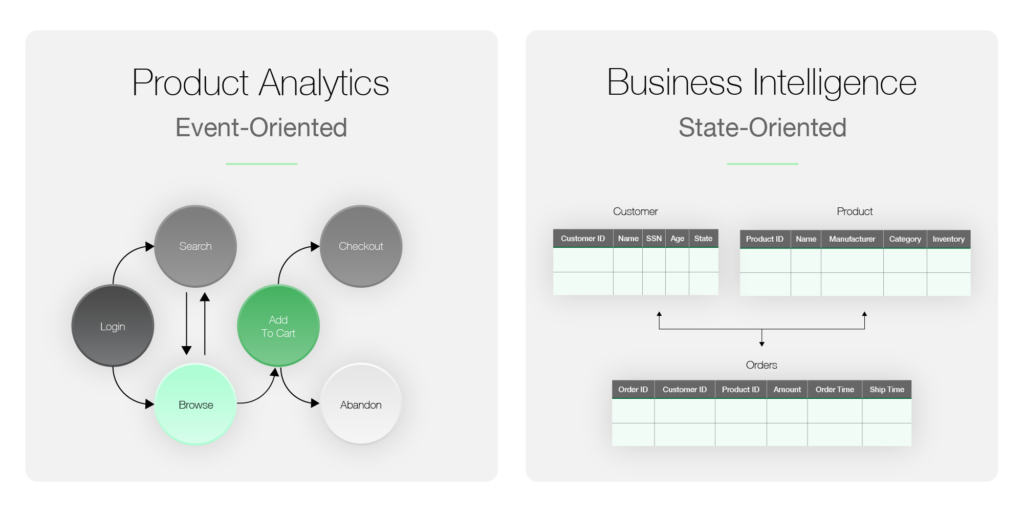
These two types of systems were architected differently – one event-oriented and one state-oriented.
But these systems were designed decades ago. What if you could start from scratch and architect a system that can serve both purposes? What if BI and Product Analytics could be converged into one platform? The business value of such a converged tool would be massive!
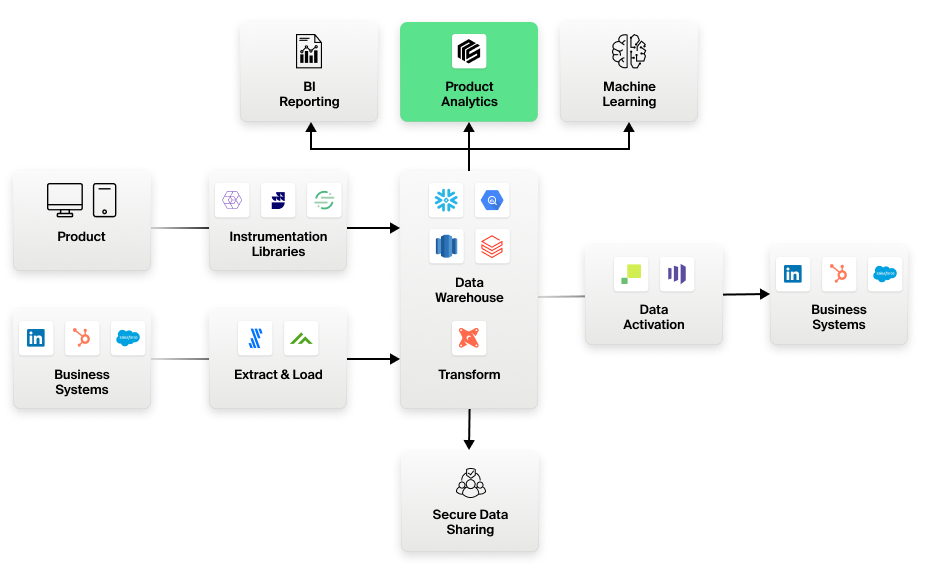
The Modern Data Stack
Generational shifts in analytics tools are often accompanied by major shifts in data architectures. Today, we are witnessing a shift to the Modern Data Stack.
Cloud Data Warehouse
At the center of the modern data stack is a cloud data warehouse like Snowflake or BigQuery. These data warehouses are the central repository of all data in modern enterprises. Even data like product instrumentation events or IoT sensor readings, that traditionally never made it to the data warehouse, are now being stored there. This is the primary shift.
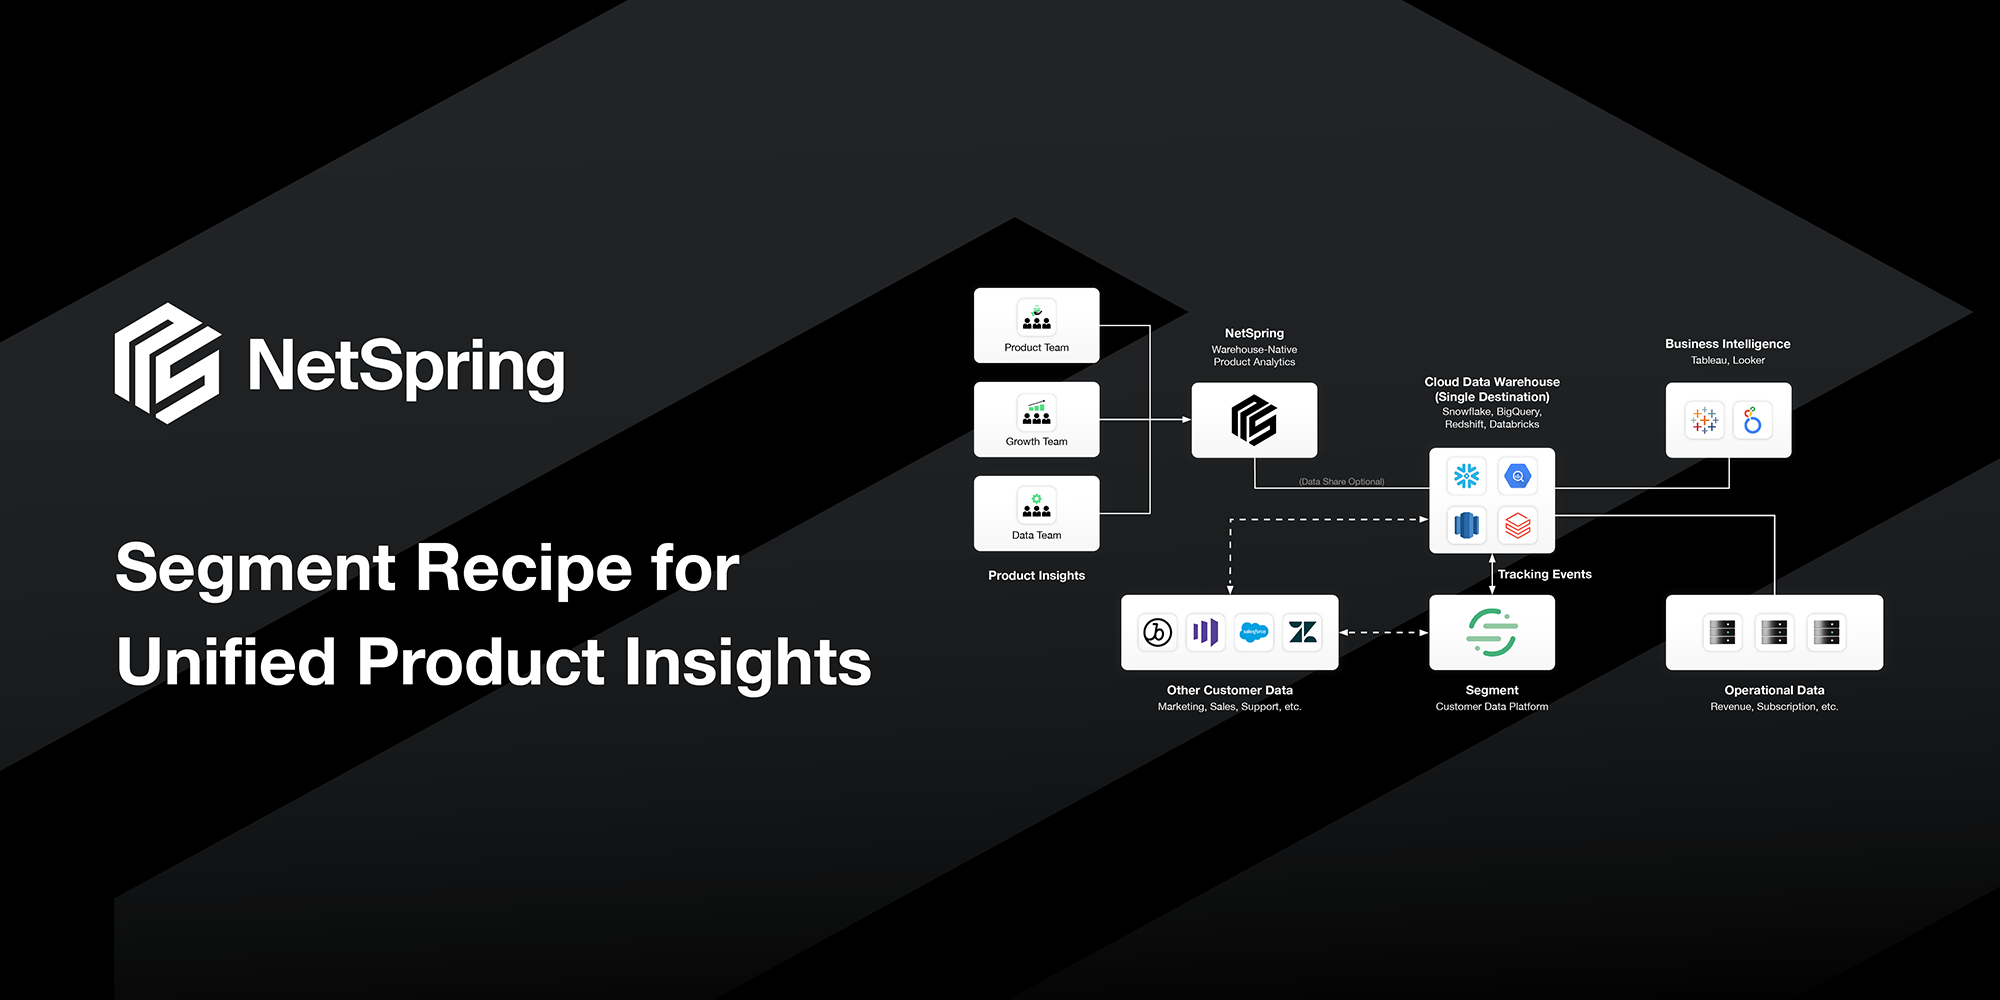
Composable CDP
The second shift is the emergence of the composable CDP. Composable CDP means using best-of-breed systems centralized on the data warehouse. This implies:
- Specialized instrumentation systems like Rudderstack, Segment, or Snowplow that are decoupled from analytics tools, providing data in neutral formats in the warehouse for anyone to easily consume. No more critical customer data going off to some black hole SaaS service.
- Specialized ELT (as opposed to ETL) tools like Fivetran bringing data from business systems like Salesforce and Zendesk to the warehouse.
- Warehouse-native data transformation tools like DBT to transform raw data into more consumable forms.
- Data activation to business systems directly from the warehouse.
- Warehouse-native business analytics sitting directly on top of the warehouse. No data leaves the warehouse ever. No additional ETL / reverse ETL mess. No spending time trying to figure out what to send (or not send) to your product analytics service to control costs.
- Higher levels of security and governance by virtue of being warehouse-centric.
The NetSpring approach
At NetSpring, we architected our system from ground-up for the Modern Data Stack. We have designed an architecture that bridges the worlds of event- and state-oriented systems. We are warehouse-native, where all computations happen inside the data warehouse, and no data ever leaves the warehouse. We provide specialized templates for product analytics, but also provide BI-style ad hoc exploratory analytics – all through a self-service interface.
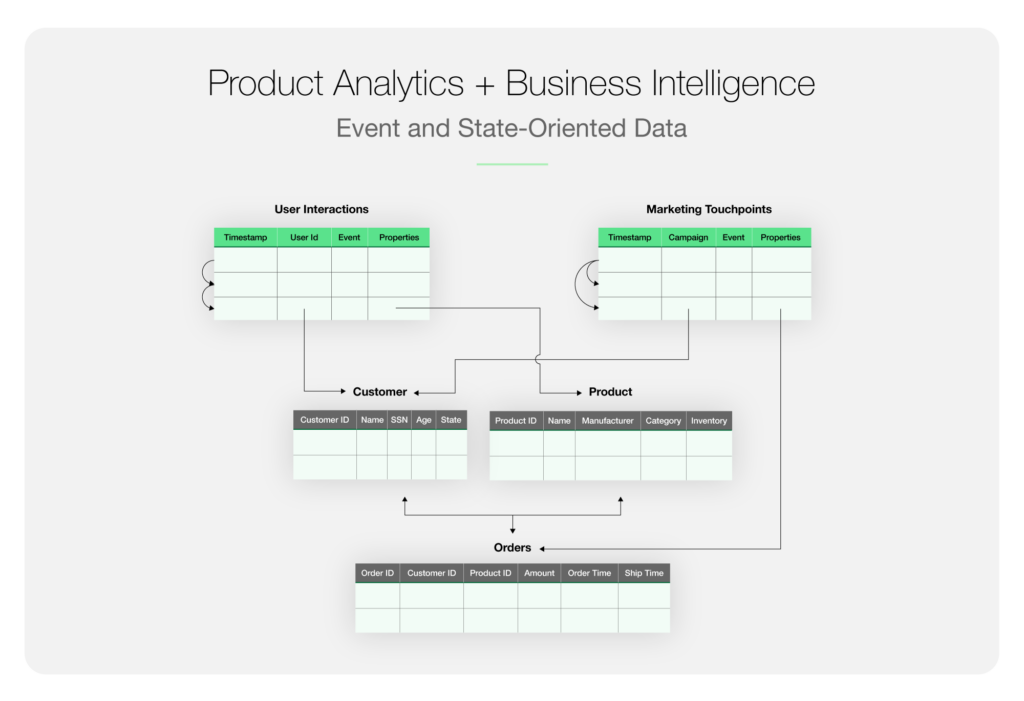
We did this by starting with a traditional relational model, and layering an event model on top. So ultimately queries that get generated, are SQL that execute against the warehouse. The traditional relational model enables BI-style dimensional slice-and-dice analyses. The event model layering enables rich expressibility and optimizations for specialized product analytics reports. A specialized language called NetScript provides an abstraction layer for optimized query processing that can perform well in the warehouse.
We believe that BI and product analytics can be done effectively in a single tool. This has massive advantages in terms of cost, governance, security, and business impactful analytics.
Just as the data warehouse is eliminating silos of data, Business Analytics systems like NetSpring are eliminating silos of analytics. A single analytics tool on a single central warehouse – this dream is coming true now. And enterprises have good reasons to embrace and celebrate it. Contact us to learn more.