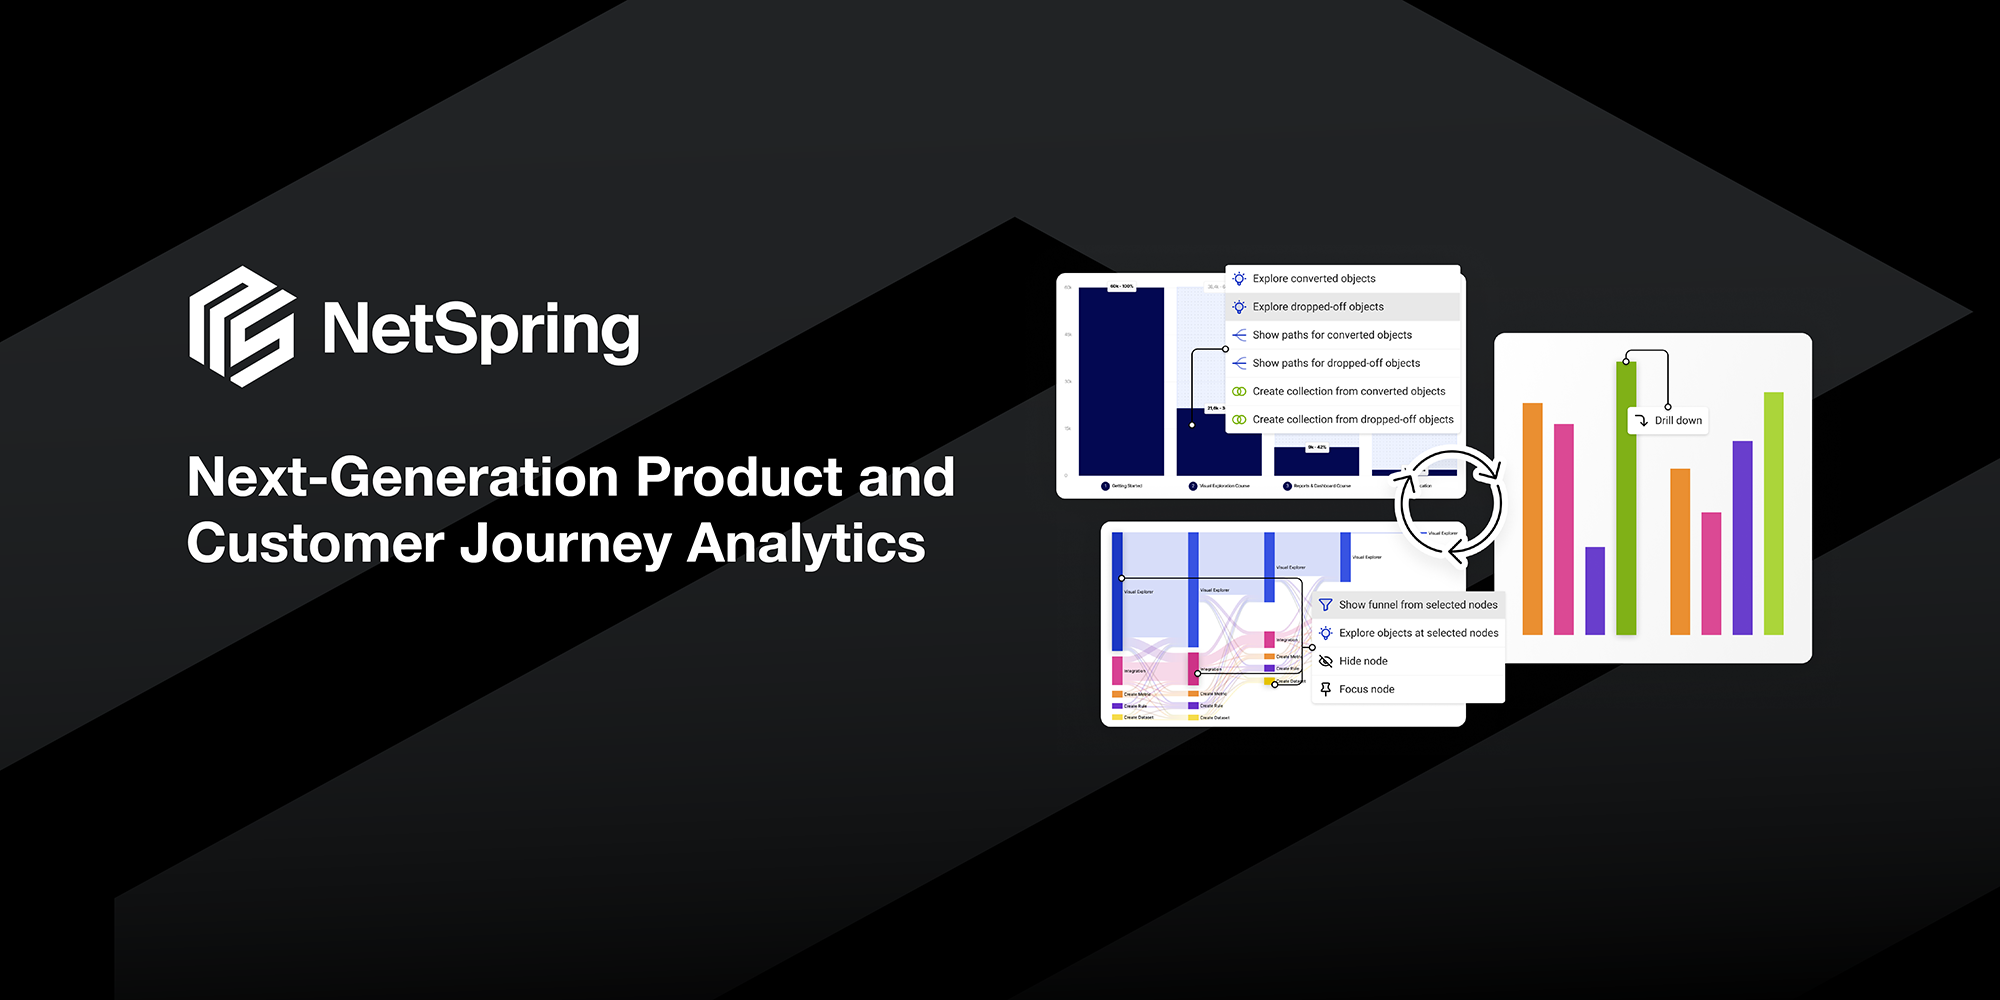
Having been in the BI space for many years with Oracle and co-founding ThoughtSpot, and now building NetSpring in the product analytics space, I’ve come to realize some interesting trends.
TL;DR – More than 50% of Product Analytics is done (painfully!) in BI tools, and more than 50% of the analytics done in Product Analytics tools is BI (done poorly!). The divide between Product Analytics tools and BI tools is due to the way these tools have evolved historically, which has resulted in huge pain and missed business opportunities. But today, Product Analytics and BI platforms are converging into a single cohesive business analytics platform, centered on the enterprise data warehouse/lake. This unlocks massive value, with powerful analytics driving better business outcomes for product-led companies.
Product Analytics rose into prominence over a decade ago when a large number of mobile apps and product-led SaaS services became pervasive. It was critical to get an understanding of product usage by users, particularly in consumer-oriented products where churn was high. At that time, there were no good options to do this well. The available analytics tools were primarily BI tools like Tableau and Qlik. These tools were good for reporting on ERP, CRM, HCM, etc. data in the warehouse. But they could not be used for product analytics because:
-
- Event data from product instrumentation never reached traditional (on-prem or even early cloud) data warehouses. Data warehouses were not designed to ingest, store, and process event data in a performant and cost-effective way.
- BI tools were not designed for expressing or computing event-oriented analyses.
- Fast moving digital product and marketing teams needed a quick solution that did not depend on slow-moving central enterprise data teams.
In BI, we’ve had three generations of tools. BI started with static reporting, evolved to OLAP analytics, moved from centralized (Oracle BI, Cognos, Business Objects) to departmental (Tableau, Qlik), and back to centralized models, with current systems centralized on the cloud data warehouse. However, BI has remained focused on dimensional slice-and-dice reporting on state data (business transactions from POS, order capture, supply chain, sales, finance, HR etc.) in the warehouse; this is of course a critical need for every enterprise. BI tools are designed for “star-schema” style dimensional analysis of aggregated metrics. BI tools and SQL are not designed to express event-oriented analytics e.g. funnels, behavioral cohorts, paths, flows etc.
Data warehouses are not optimized to efficiently process event-oriented queries. Naive attempts to run product analytic workloads with a BI/SQL tool on warehouses leads to very poor query performance and high cost. These workloads are characterized by extremely high volume time series data and queries involving time-ordered sequences sharded by User, which requires expensive shuffle operations.
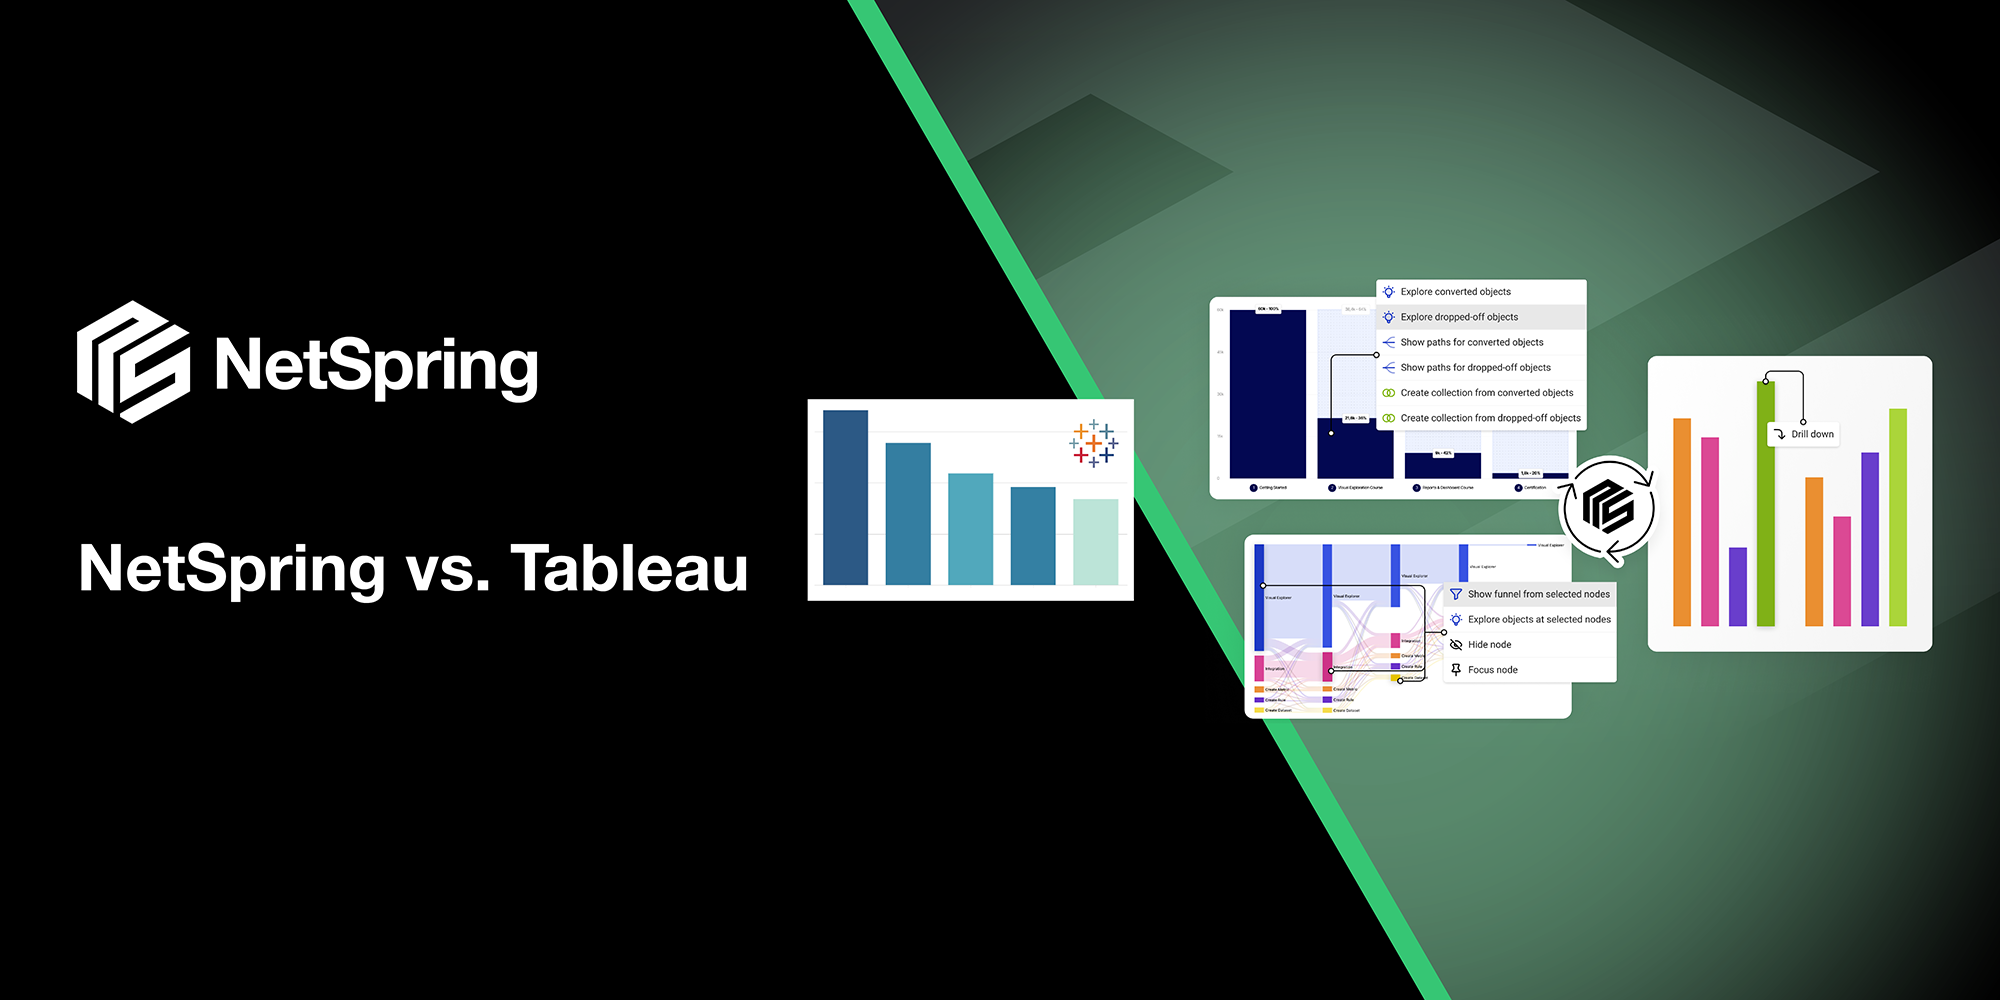
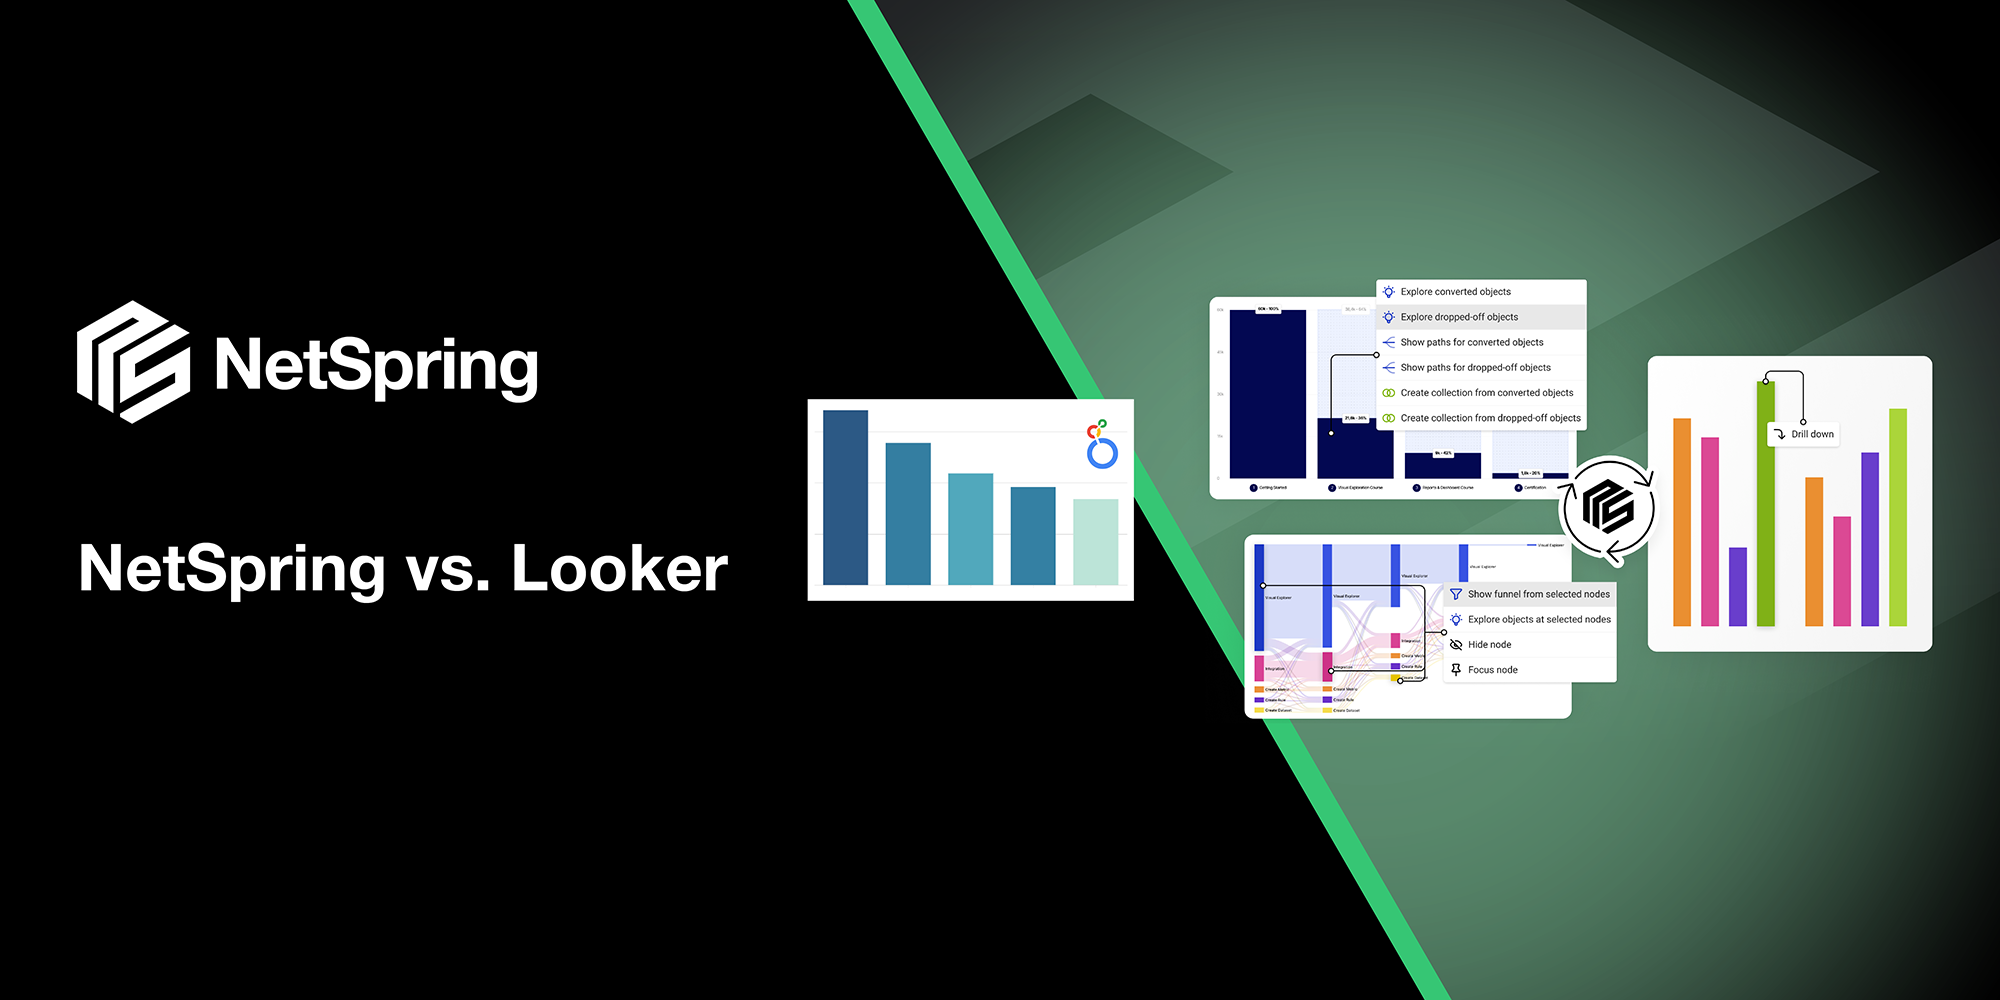
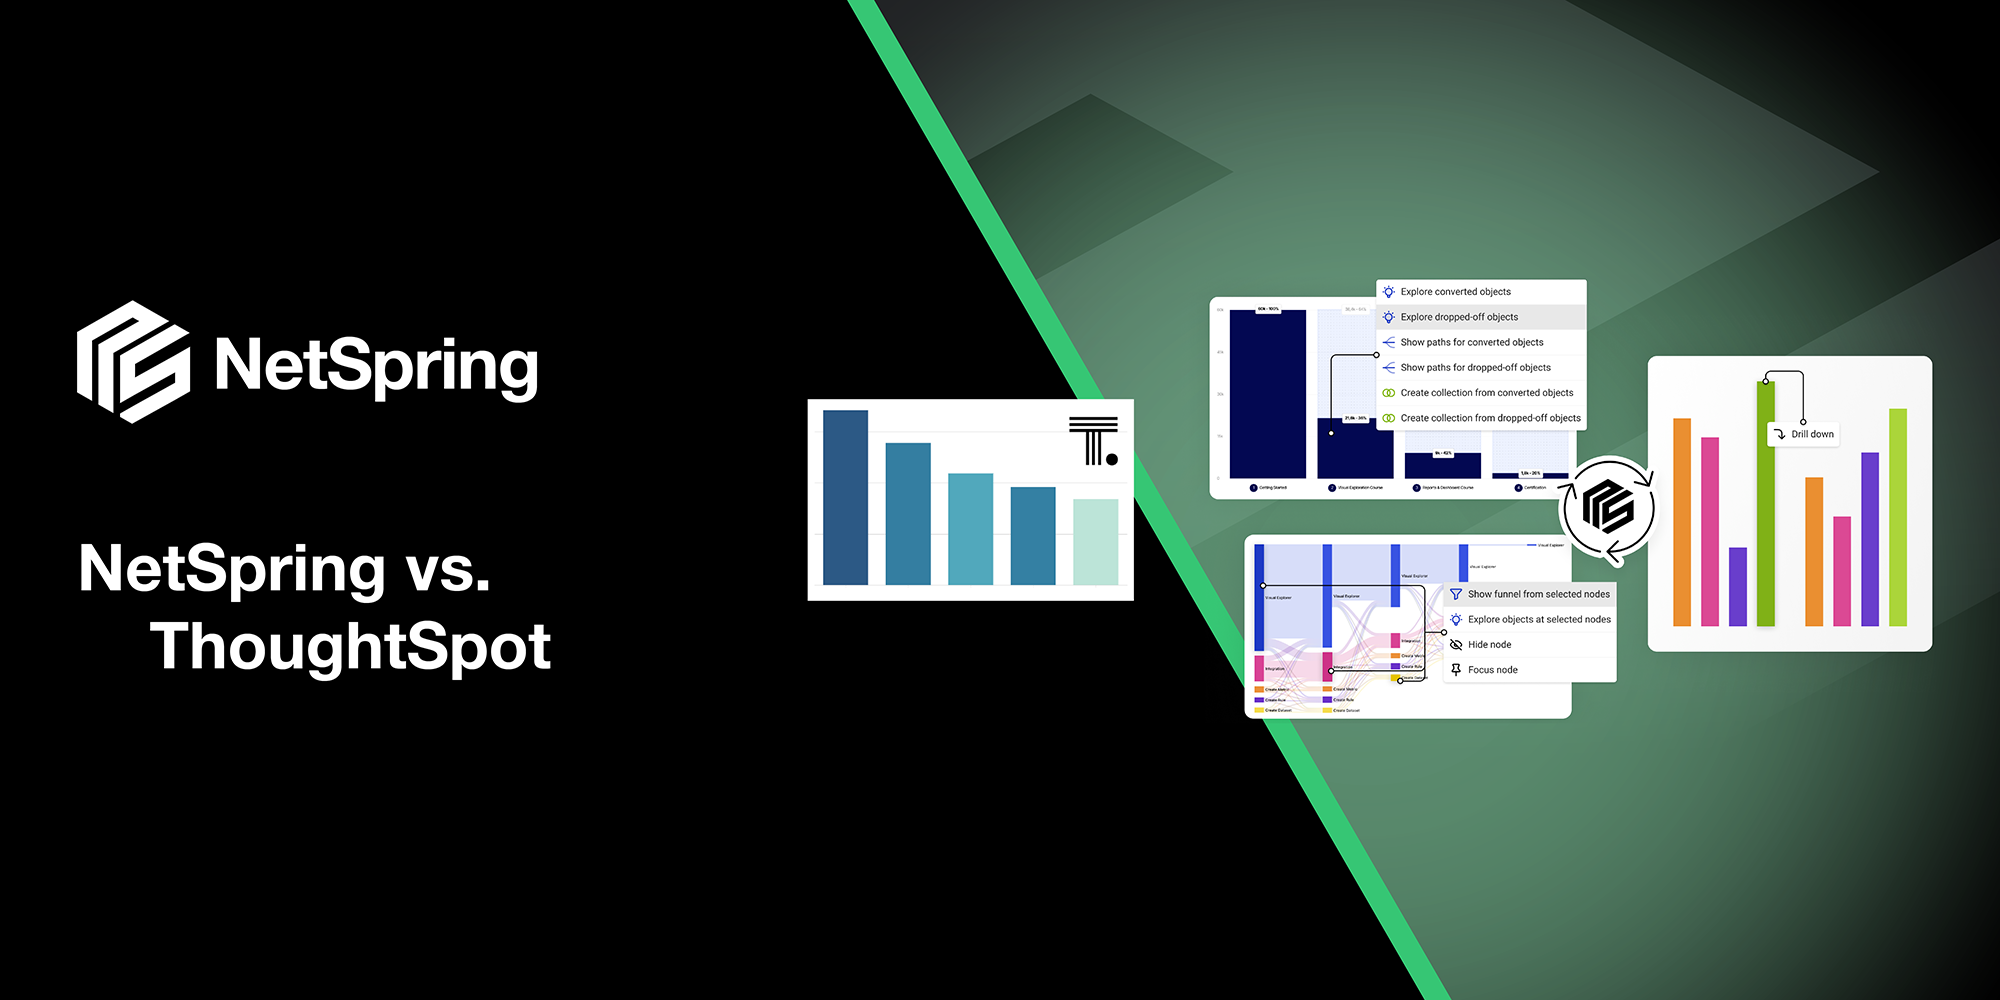
As a result, we have had two parallel analytical systems evolve over the last decade – product analytics tools like Amplitude, Mixpanel, Heap with a packaged offering including proprietary and closed instrumentation, storage and compute; and BI systems like Tableau, Looker, Power BI, ThoughtSpot, that work off data in data warehouses.
So what’s the problem with having two separate systems?
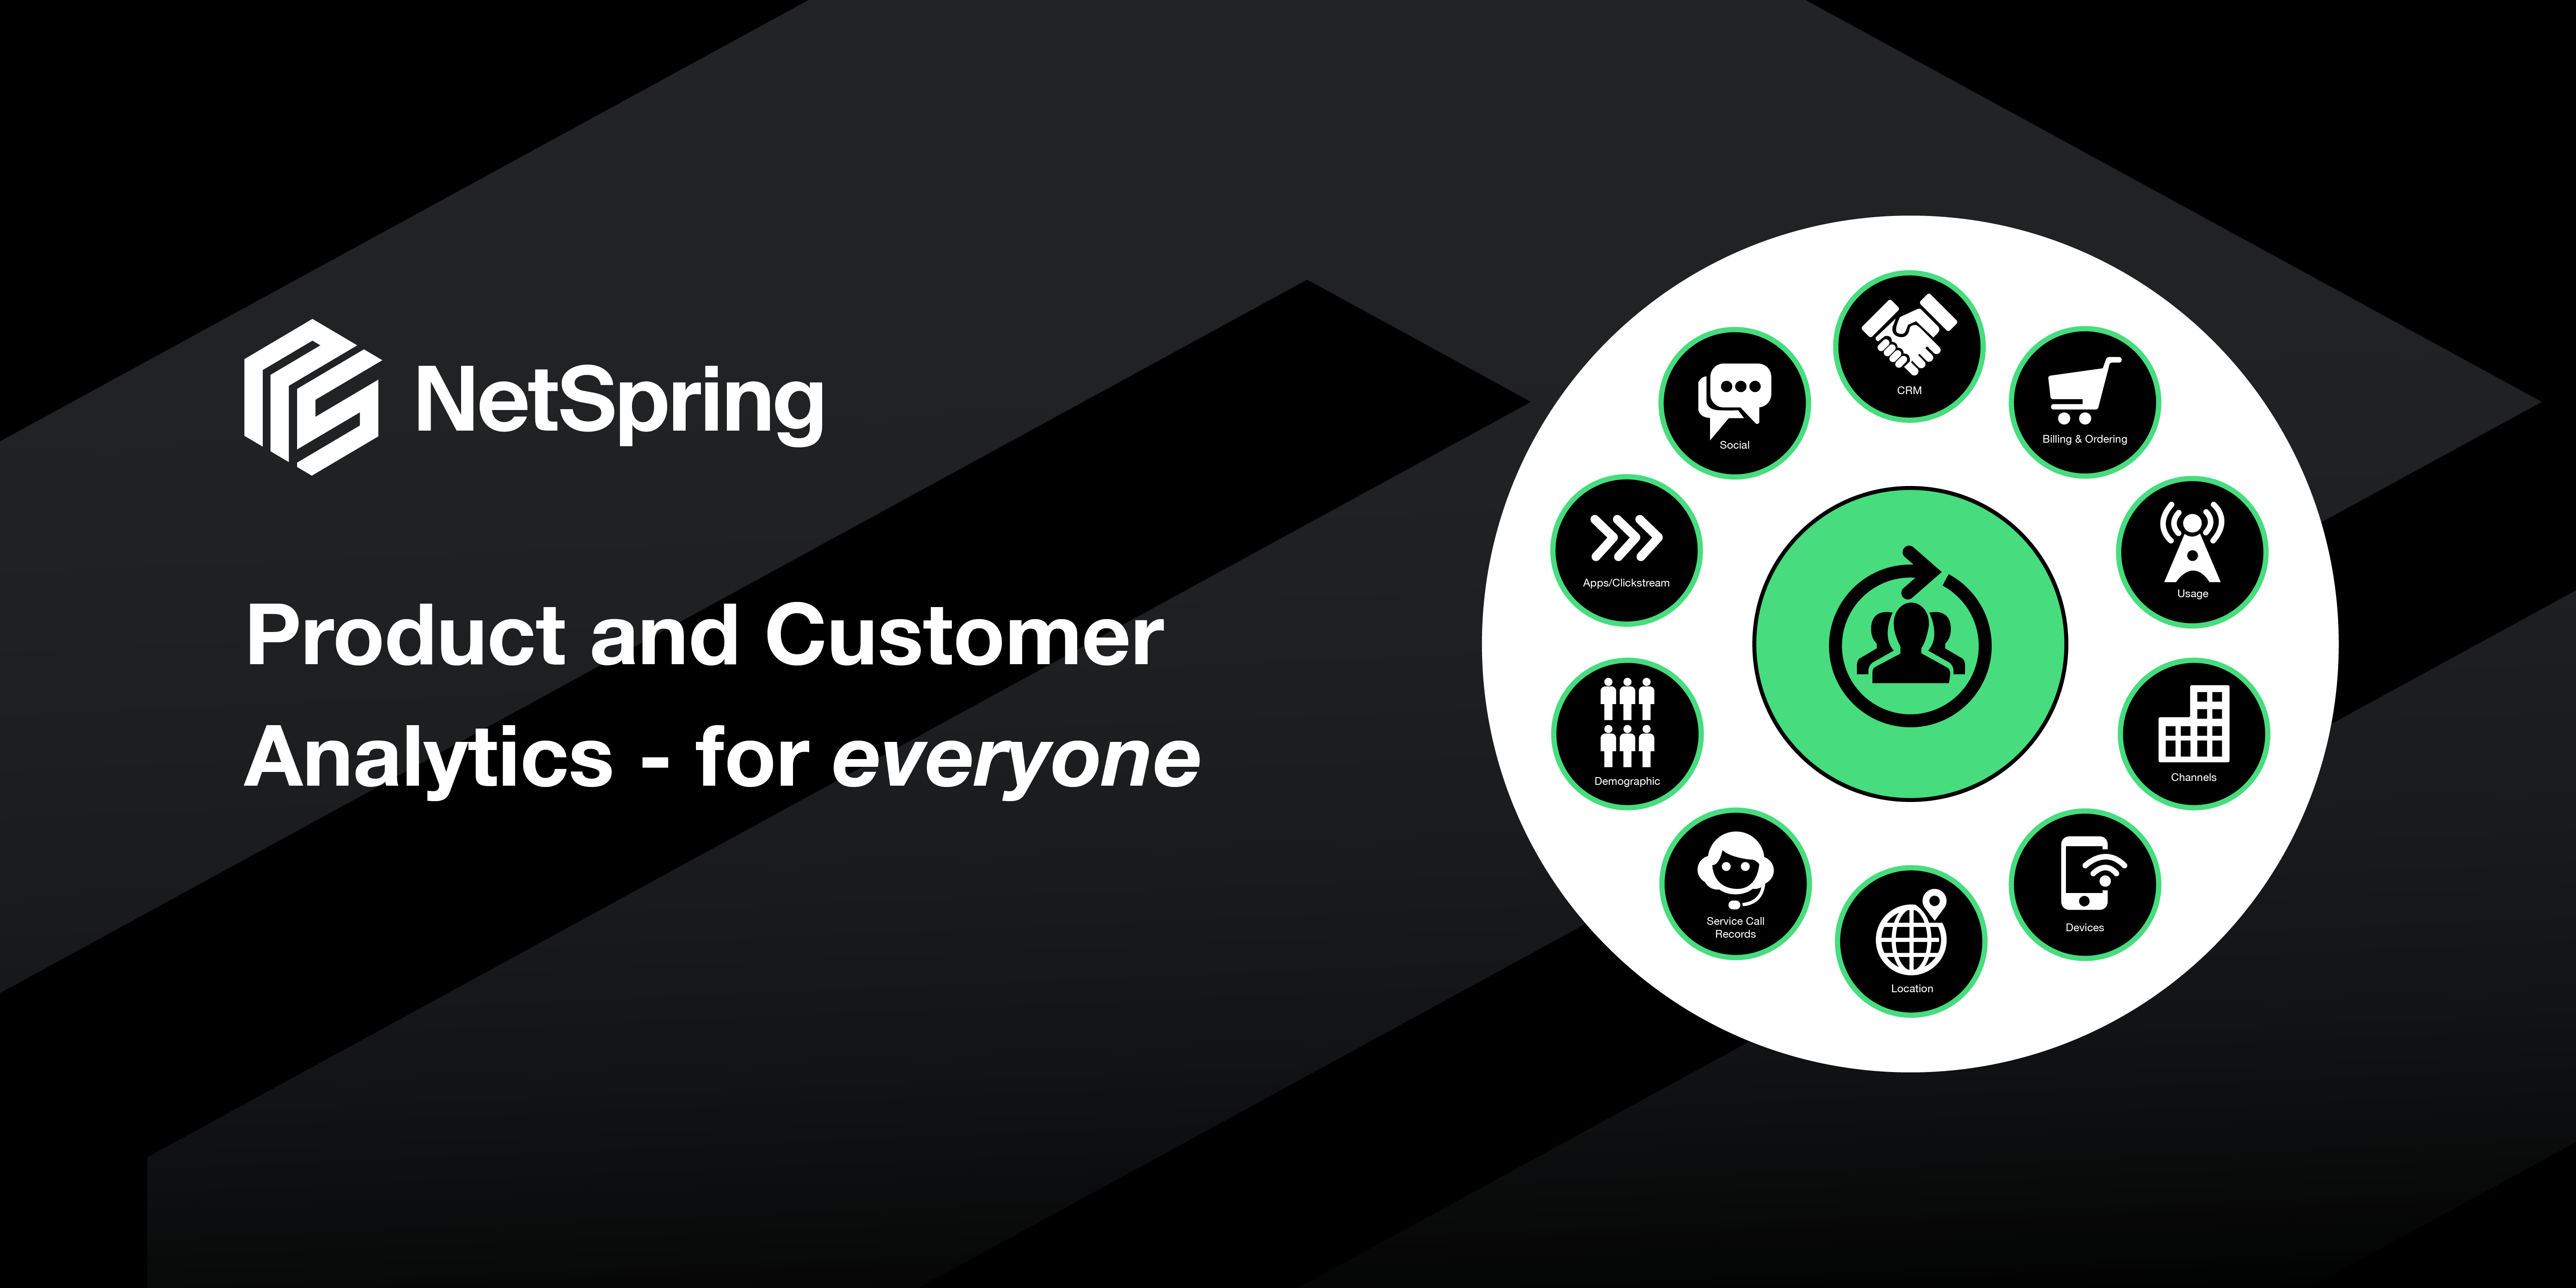
Product analytics in first-generation tools like Amplitude and Mixpanel has been focused on analyzing just product instrumentation streams to provide product managers visibility into product usage. This siloed view has always been very limiting. This is further exacerbated in recent times with PLG-driven motions, where companies want a 360-degree view into their customers – across all channels of interactions, and incorporating context from all business systems.
Consider a traditional product analytics tool showing you that conversion rates have increased following the release of a new feature. However, what if the majority of customers who converted ended up canceling by calling your call center? That data is not in the siloed product instrumentation stream that traditional tools work with. It is in a different business system that is inaccessible to first-generation product analytics tools. Similarly, can you understand the impact of a product change on support tickets/calls – data that is in Zendesk? Can you understand product engagement by subscription tier – data that is in Salesforce? Can you be alerted to product friction or increased engagement in accounts whose renewal is coming up in a month – data that is in NetSuite?
Can you break down subscription revenue by cohorts of customers? Can you prioritize product issues based on impact on revenue? Can you target the right set of customers with the right campaigns/offers/nurture based on their lifetime value?
It is no longer sufficient to understand narrowly-defined product metrics based on just product instrumentation data. As modern businesses evolve to product-led growth, product teams are quickly becoming revenue centers, and need to graduate from product metrics to business metrics, with product instrumentation data being just one source of input. They need a business analytics tool that provides a broader view. They need business analytics to be more impactful and influential with the C-suite.
First-generation tools have made feeble attempts to address this with simplistic “reverse ETL” solutions. But these solutions are cumbersome, incomplete, and expensive. So as customers grow, they invariably end up doing more and more of the heavy lifting in BI tools. This is problematic because:
-
- Data needs to be exported out of product analytics tools to the data warehouse to do the next level of analysis using BI tools. This requires error-prone ETL jobs that increase TCO.
- In scenarios where product instrumentation data is already in the warehouse, there is a huge cost of reverse ETL-ing a copy of this data to first-generation product analytics tools. The warehouse data models could be complex involving many different entities that have to be artificially stuffed into the rigid Event-User model of traditional product analytics tools. Furthermore, often only a subset of data from the warehouse is sent to these tools to control prohibitive costs – this results in inconsistencies across the two systems.
- BI tools are not designed for product analytics. So building in BI tools is very cumbersome for data teams. This results in huge costs as business users send repeated requests for new reports. Inundated data teams don’t have the time to do higher value work. Business teams have to wait for weeks to get reports.
- Analytics becomes fragmented with some done in a product analytics tool and some done in a BI tool. The inevitable “numbers don’t add up” problem surfaces, burning a lot of time on debugging and rationalizing numbers across multiple tools and data copies.
- Users lose trust in the numbers from product analytics tools, waiting instead for weeks to get basic high-level BI reports. The ROI of product analytics is diminished and the opportunity to do business-impactful analytics is lost.

The great divide
Here’s the reality today:
More than 50% of Product Analytics is done (painfully!) in BI tools, and more than 50% of the analytics done in Product Analytics tools is BI (done poorly!).
The picture below summarizes the pros and cons of these two systems for product analytics.

The grand convergence
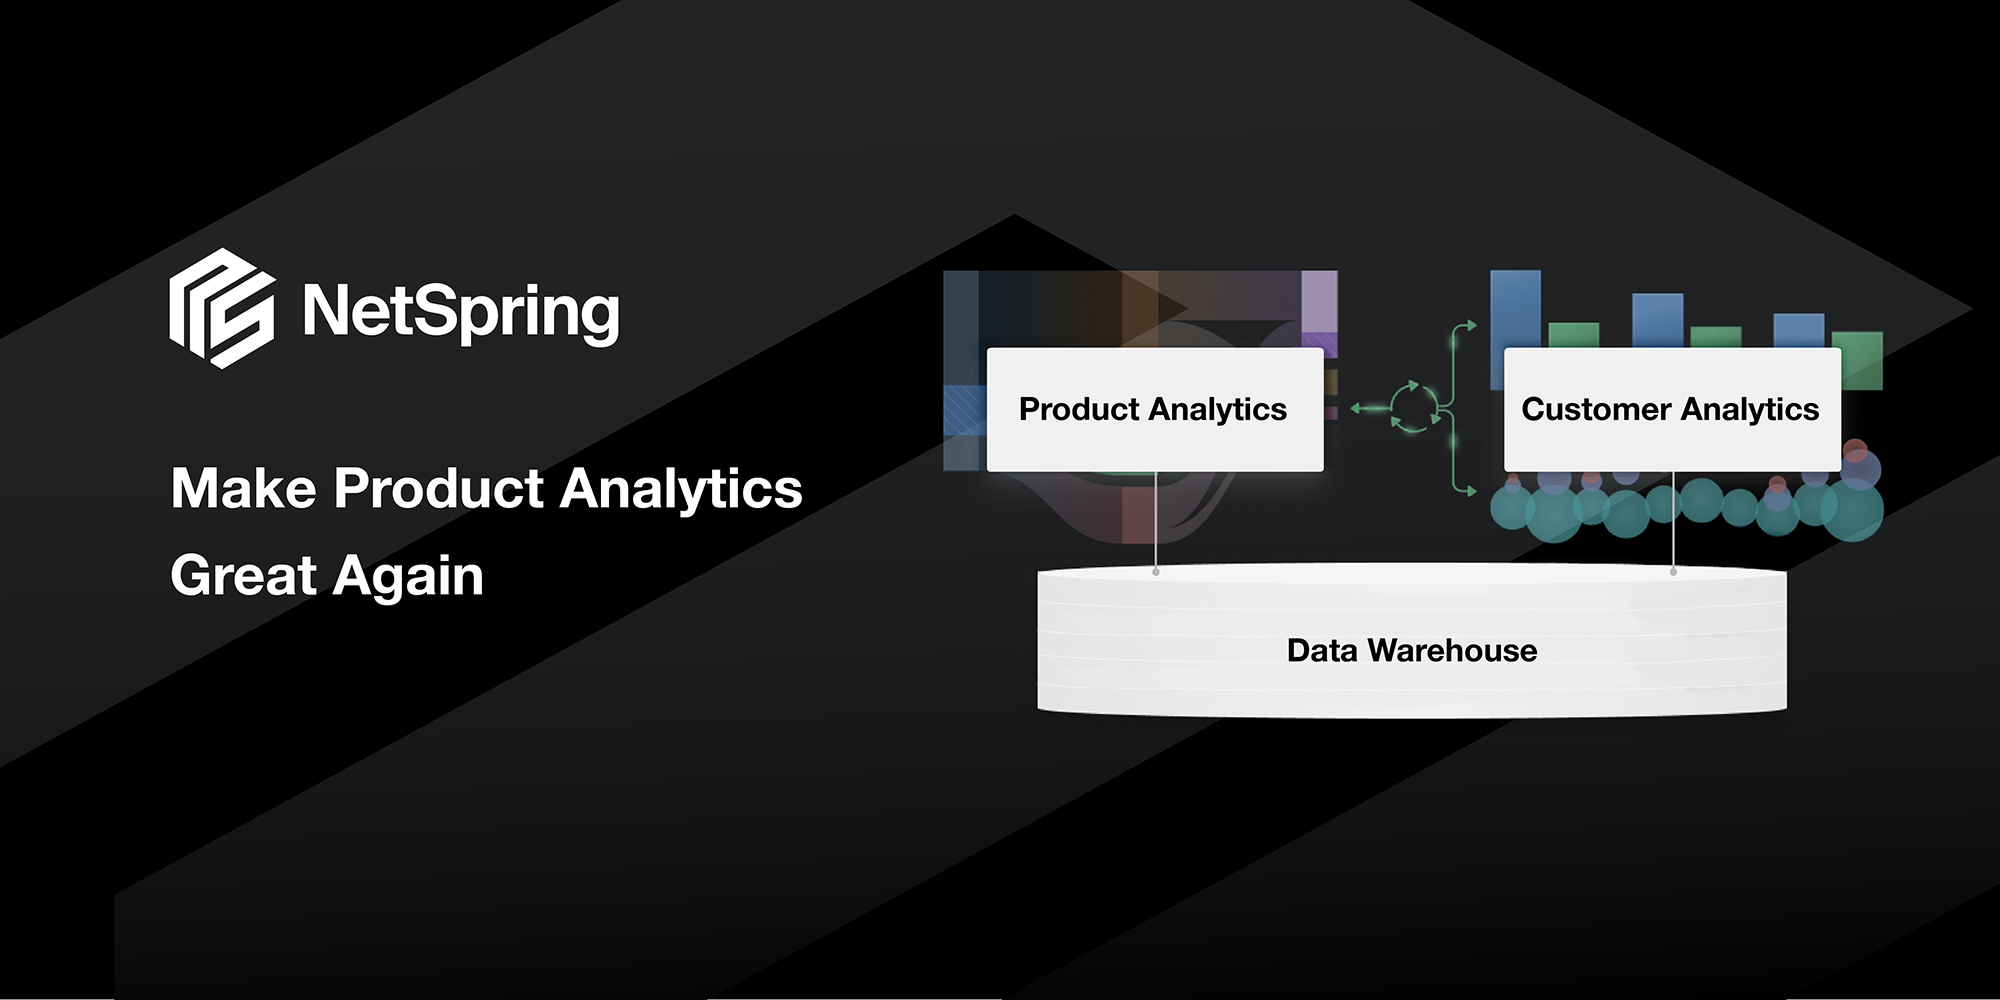
The divide between Product Analytics tools and BI tools is due to the way these tools have evolved historically, which has resulted in huge pain and missed business opportunities. But today, Product Analytics and BI platforms are converging into a single cohesive business analytics platform, centered on the enterprise data warehouse/lake. This unlocks massive value, with powerful analytics driving better business outcomes for product-led companies. NetSpring is at the forefront of this revolution.
NetSpring provides all the goodness of a purpose-built, template-driven tool for product analytics. But it is designed differently from the ground up. It is built on a familiar relational model for state data in the warehouse, with an event orientation layered on top. As a result, NetSpring’s powerful modeling and query engine can service any analytical computation – across event and state data. You can seamlessly go back and forth from a templated report to ad hoc analysis, propagating context bi-directionally and fully. You can use every piece of relevant data in the data warehouse.
NetSpring’s innovative query generation engine makes it possible to deliver on optimal cost/performance ratios for product analytics queries working at scale on data warehouses. NetSpring employs a sophisticated query compiler that has several optimizations / heuristics built in to make these workloads run with acceptable cost and latency. The NetSpring query compiler has built-in support for techniques such as automatic sampling, materialization, and indexing.

The Modern Data Stack
The modern data stack that is gaining increasing popularity is characterized by two things – warehouse-native architectures and composable CDPs. NetSpring’s architecture and POV are aligned with these two characteristics. NetSpring is on a journey to build the “Analytics Cloud” – the go-to platform in enterprises for all business-oriented analytics.
Analytics Cloud – the go-to platform in enterprises for all business-oriented analytics.
Warehouse-native architecture
Enterprises are increasingly adopting the model of centralizing all data in modern cloud data warehouses. This includes event data from product instrumentation, IoT, devices, sensors, logs etc. Modern data warehouses offer the advantage of cheap storage and elastic compute where you only pay for what you use in queries. It is now feasible to stream in and store PB-scale data in data warehouses.
Composable CDP
The composable CDP paradigm involves centralizing all customer data in the warehouse instead of separate silos as traditional CDP systems like Segment use. Composable CDP is also characterized by best-in-class instrumentation, analytics, experimentation, AI/ML, and activation tools working natively on top of the data warehouse.

What should you do if you have both a first-generation Product Analytics tool and a BI tool?
Get rid of your outdated first-generation product analytics tool. Switch to NetSpring. Centralize all your product instrumentation data in the data warehouse in an open format available for everyone to consume.
Use your BI tool for what it is designed for – production reporting with a producer/consumer model, for Finance, HR, Sales, Supply Chain etc. Do all product and customer oriented analytics in NetSpring. Make NetSpring the default tool for all analysts and consumers in product, engineering, marketing, growth, success, and support teams.
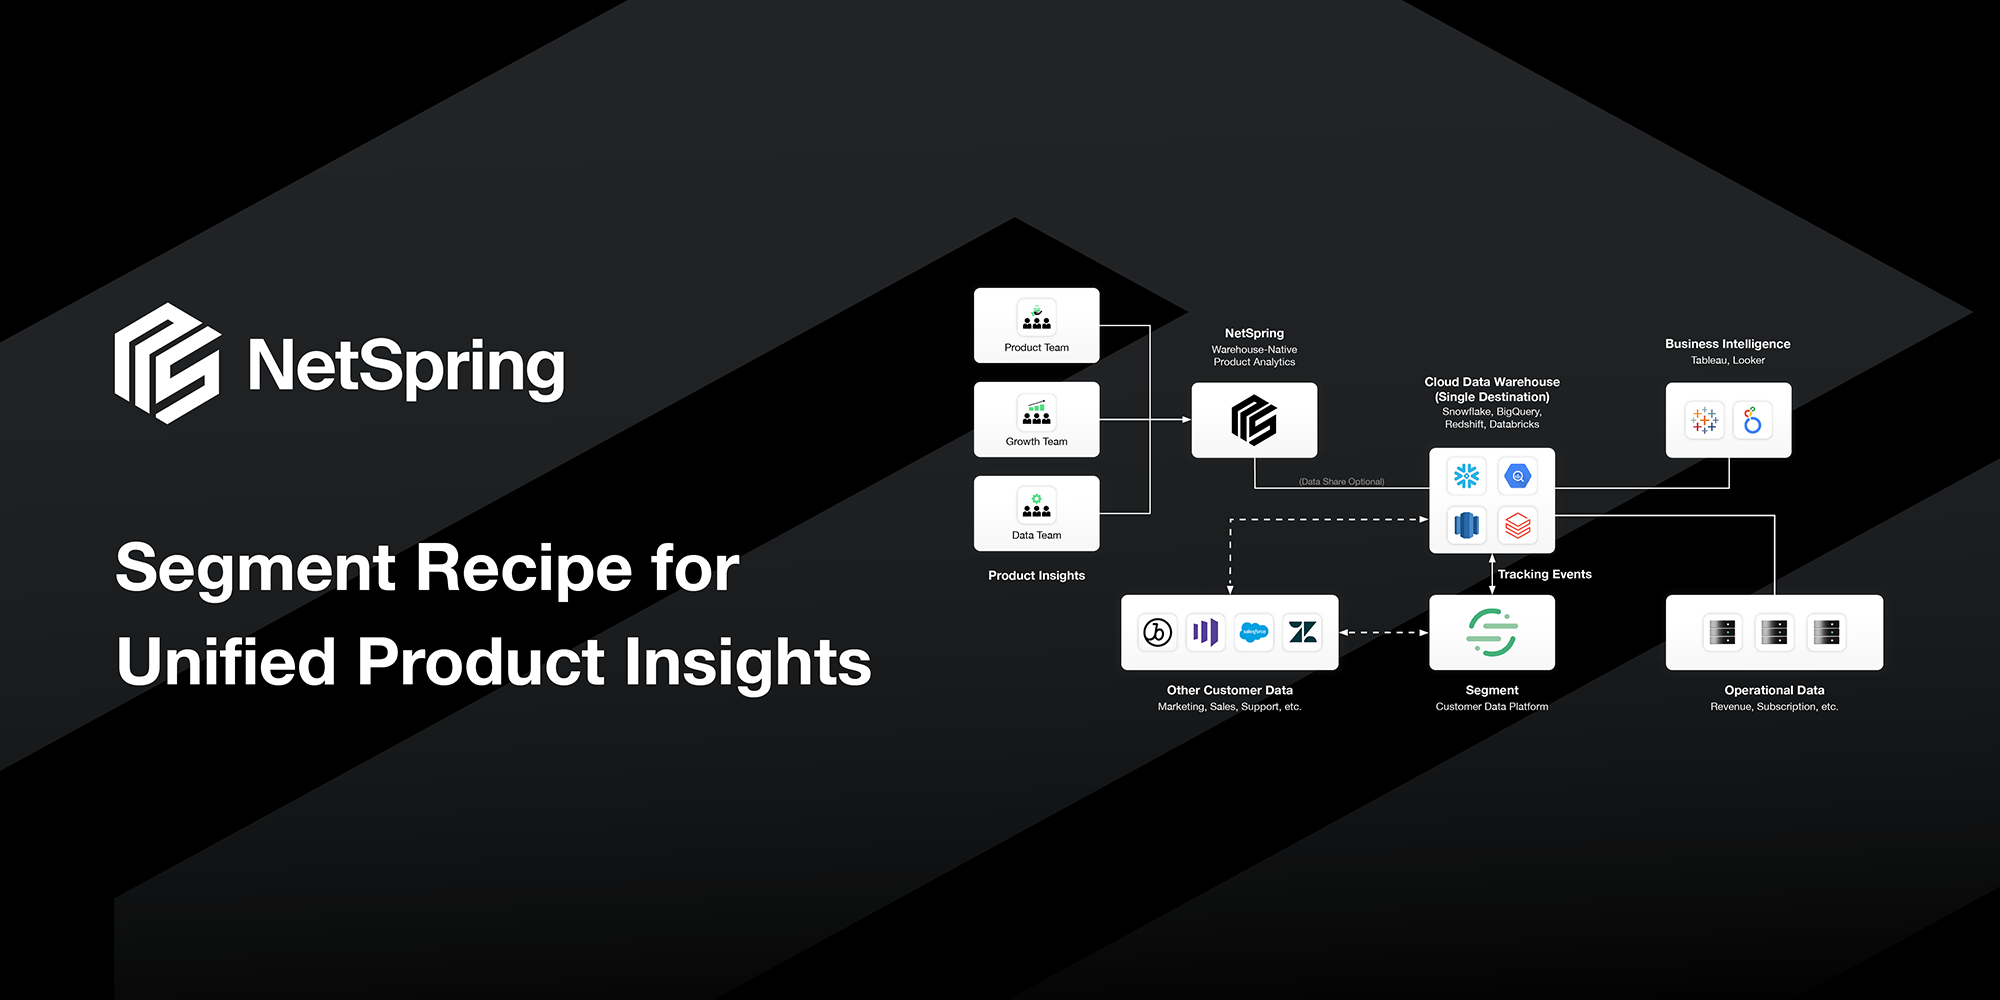
The picture below shows where NetSpring fits with your BI tools.

Upgrade to the next generation of analytics with NetSpring
Never again feel constrained by your product analytics tool. Never call your data teams to build you a report in a BI tool for your next level of analytical questions. Never copy data out of your secure central warehouse. Never compromise on data fidelity and live with rough or approximate analysis. Never feel constrained by lack of access to all historical data. Never pay a price penalty for your company’s growth generating more event data; instead, pay only for usage and value. Never spend time trying to figure out the source of truth for your metrics. Never feel scared to put out numbers from your product analytics tool to the C-suite.
With NetSpring, you can make data-driven decisions with confidence in a single, consistent, trustworthy, cost-effective, self-service tool. Make a real impact on business outcomes with NetSpring.
Sign up today for a 14-day risk-free trial.