Self-service business intelligence (BI) has been talked about for decades. But broad self-service for a majority of business teams in the enterprise still remains a pipe dream. Vendors have attempted different flavors of self-service with limited success. NetSpring is following a templated and modularized approach to enable self-service BI for business and data analysts. We believe this is the missing link to achieving true enterprise-wide self-service.
Self service for whom?
Let’s ask the question – for whom in the organization do we want to provide self-service analytics? From a BI perspective, a typical organizational pattern involves four distinct groups – business consumers, business analysts, data analysts, and data engineers. Your organization may have a different structure e.g. business analysts and data analysts may be the same group, or business consumers in some teams may be analytically savvy business analysts, but the concepts described below still apply.

- Business Consumers – At the top are the business consumers – the group that mostly consumes analytics and does not author. Business consumers are the day-to-day operators of the business in Product, Marketing, Finance, HR, Supply Chain, Sales, Support, Success, IT etc. Business consumers are the least analytically savvy, but understand the intricacies of their business functions very deeply. They are the domain experts. A lot of the questions that require data analysis come from business consumers who are operating their fast-moving business daily. Business consumers typically cannot write SQL or use analytics tools of any complexity beyond Excel.
- Business Analysts – The next are business analysts. Business analysts are dedicated to their respective business functions and serve as the provider of analytics for business consumers. Their expertise is analytics, along with a good understanding of the business function they serve. Business analysts are typically part of Ops teams – Marketing Ops, Product Ops, Business Ops, Sales Ops, IT Ops, Digital Ops etc. Business analysts take questions from business consumers and work on providing data-driven answers to the questions. Business analysts have a good understanding of the semantics of the data they analyze. Business analysts use Excel, BI tools, and even write SQL. But for most things, they rely on data teams to build reports for them. Business analysts are the bridge between business consumers and data analysts.
- Data Analysts – The third group is data analysts. Data analysts are typically part of a centralized data function and serve a variety of different business functions. Data analysts are typically part of teams such as Data Science, Business Analytics, Business Intelligence, and Data Analytics. Data analysts are the expert authority on analytics in the company. They work with business analysts providing expertise in the structure of the data, its modeling, and building reports for business analysts. They provide requirements to data engineering to ensure all data needed for analytics is available in the right form and at the right cadence. Data analysts are experts in BI tools, SQL, Python, and AI/ML.
- Data Engineers – The last group is data engineers. Data engineers are responsible for managing the data infrastructure including operational data stores, data warehouses, ETL/ELT jobs, access control, conformance to security, privacy and governance policies, audit, cost management, and performance tuning.
So business consumers depend on business analysts, who depend on data analysts, who in turn depend on data engineering. This results in inefficiencies and long wait times for analytics. Oftentimes, data-driven decisioning is abandoned because by the time a business person gets an analysis done, business conditions have changed and the analysis is not relevant anymore. Providing more self-service and reducing dependence on other teams for analytics can have a huge impact on an organization’s ability to make timely data-driven decisions and impact business outcomes positively.
Let’s look at what self-service could mean for the three groups actively involved in producing and consuming BI.
Business Consumers
Self-service for business consumers takes two forms – dashboards and natural language interfaces:
- Dashboards
- Natural language interfaces
Dashboards are the most widely consumed BI content by business consumers. These dashboards are operational in nature and capture key metrics and their breakdowns with visualizations organized into logical groups. Dashboards typically have prompts or filters at the top for various dimensions e.g. Time, Product, Region, Customer etc. Consumers can look at various slices of data by applying various combinations of filters. In addition, consumers may perform basic drill downs within visualizations.

Dashboards help answer common questions consumers have on a regular basis. What about questions that are not covered by dashboards? After all, it is not possible to anticipate every possible question and pre-build dashboards for all of them. Business consumers have many ad hoc questions for which they need answers immediately. For basic ad hoc questions with a simple answer, it is possible to have a natural language interface where the consumer can simply ask the question in natural language and have the system (driven by LLMs) generate the appropriate answer. Relatively simple questions which have no ambiguity and produce a single answer are amenable for natural language based self-service. With advances in LLM technology, this is likely to get better and better over time.

Business Analysts
When business consumers have more complex ad hoc questions that cannot be answered through dashboards or are too complex for a natural language interface to handle accurately, they turn to business analysts. For example – “analyze why conversion rates dropped last quarter”. These kinds of questions often require deep and iterative analysis to get answers. Often these questions have multiple answers. The result of this analysis is a series of explorations and commentary about the analysis steps leading to the conclusions. This is where the biggest challenge with self service is. A vast majority of business analysts can only do some of this themselves (particularly with the help of LLMs), but for most part, have to rely on data analysts. This is because the BI tools (if they even have access to them) are too complex and are not designed for self-service.

Data Analysts
Data analysts are analytically very savvy. While they are capable of building everything themselves, they could benefit from providing business analysts a self-service tool to avoid having to service repeated requests for every question. Data analysts are often heavily loaded with such reporting requests, and business teams have to wait a long time for answers. Data analysts can also benefit from building for business in the same tool that is used by both teams. This allows for collaborative development with opportunities to build the basic analysis in the tool, and have the business pick up and build up on it. Over time, more and more is done by business teams themselves. Finally, data analysts can also save time by using self-service tools with UI-driven templates and modular abstractions – this allows for rapid development of analytical elements and reuse of building blocks across multiple analyses. This results in huge time savings for data analysts who can then dedicate more time for higher-value work.

NetSpring’s self-service BI capabilities
At NetSpring we are focussed on providing self-service analytics for business analysts and data analysts. As with every product, we are incorporating generative AI technologies into an “analytics co-pilot”. But we believe that generative AI technologies alone will fall short without the foundational intermediate layer of abstraction. The intermediate layer includes the following elements that are missing in traditional BI tools:
- Templates
- Blocks
- Cost/Performance optimization
- Analyzing across event- and state-oriented data
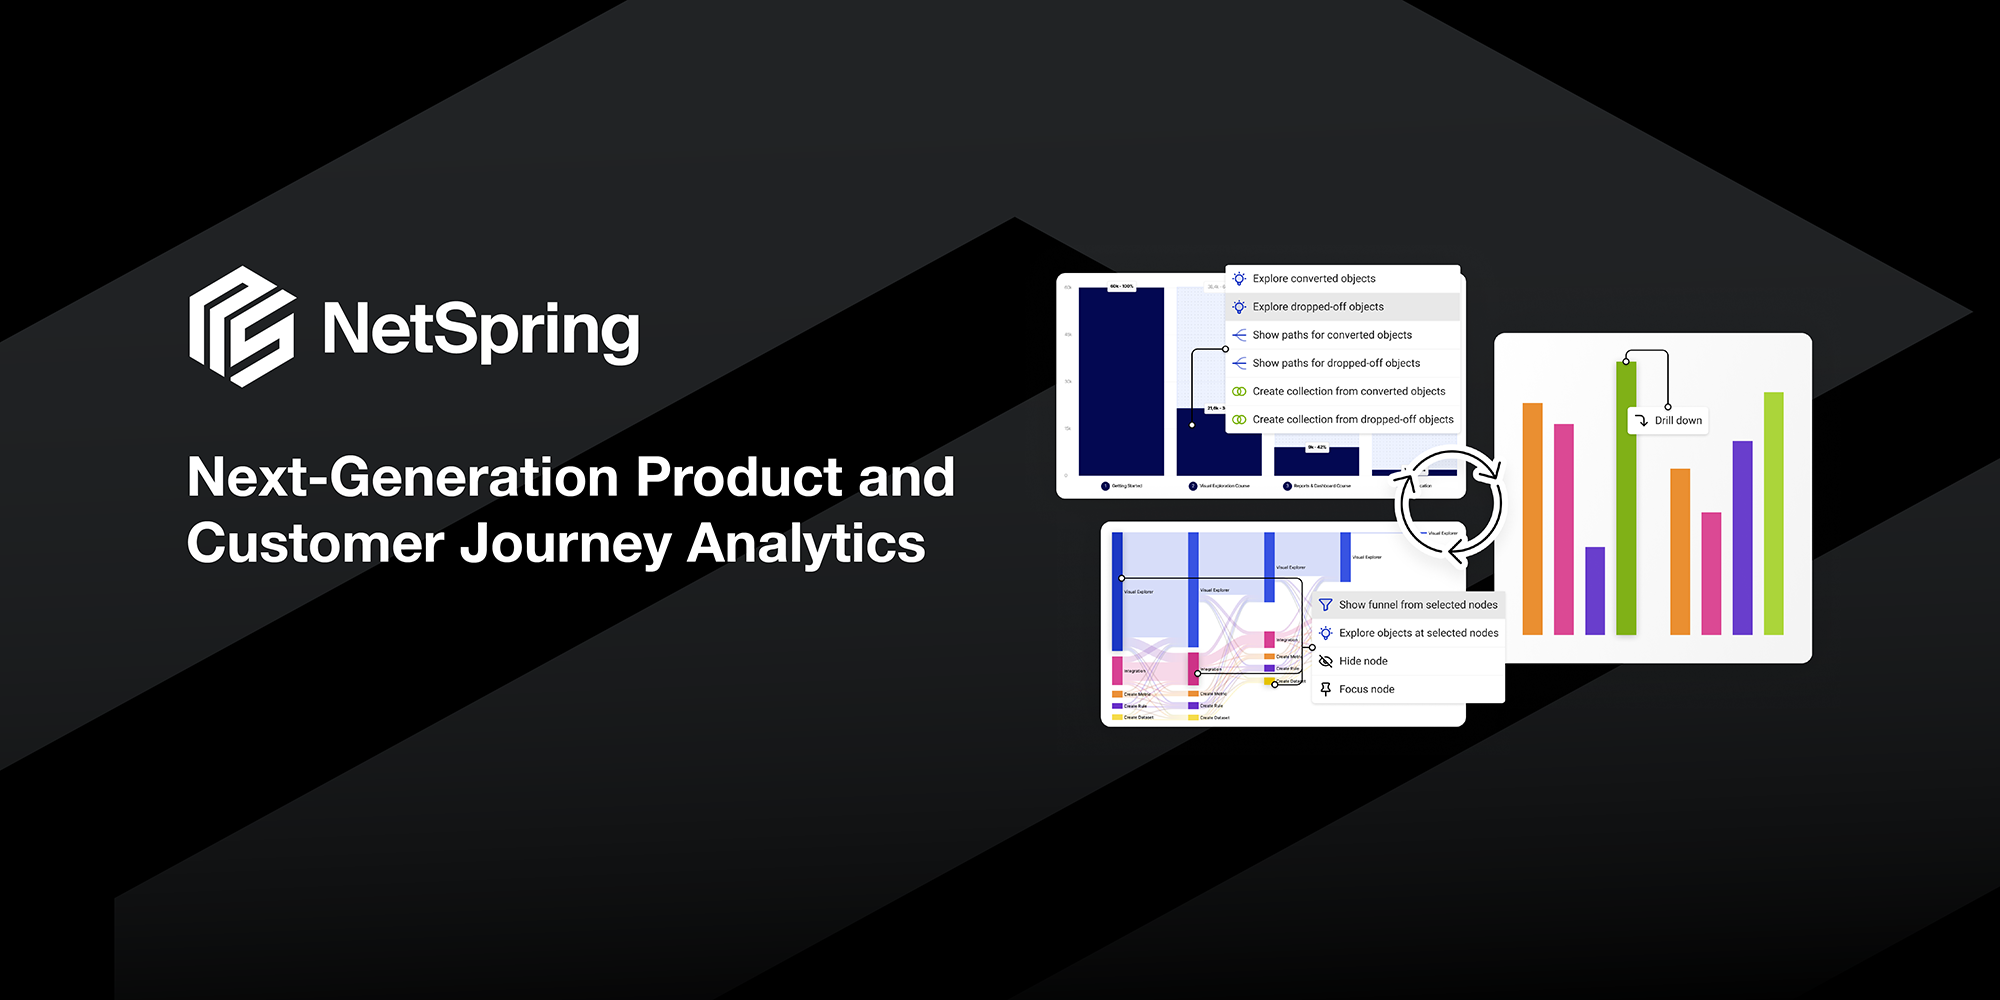
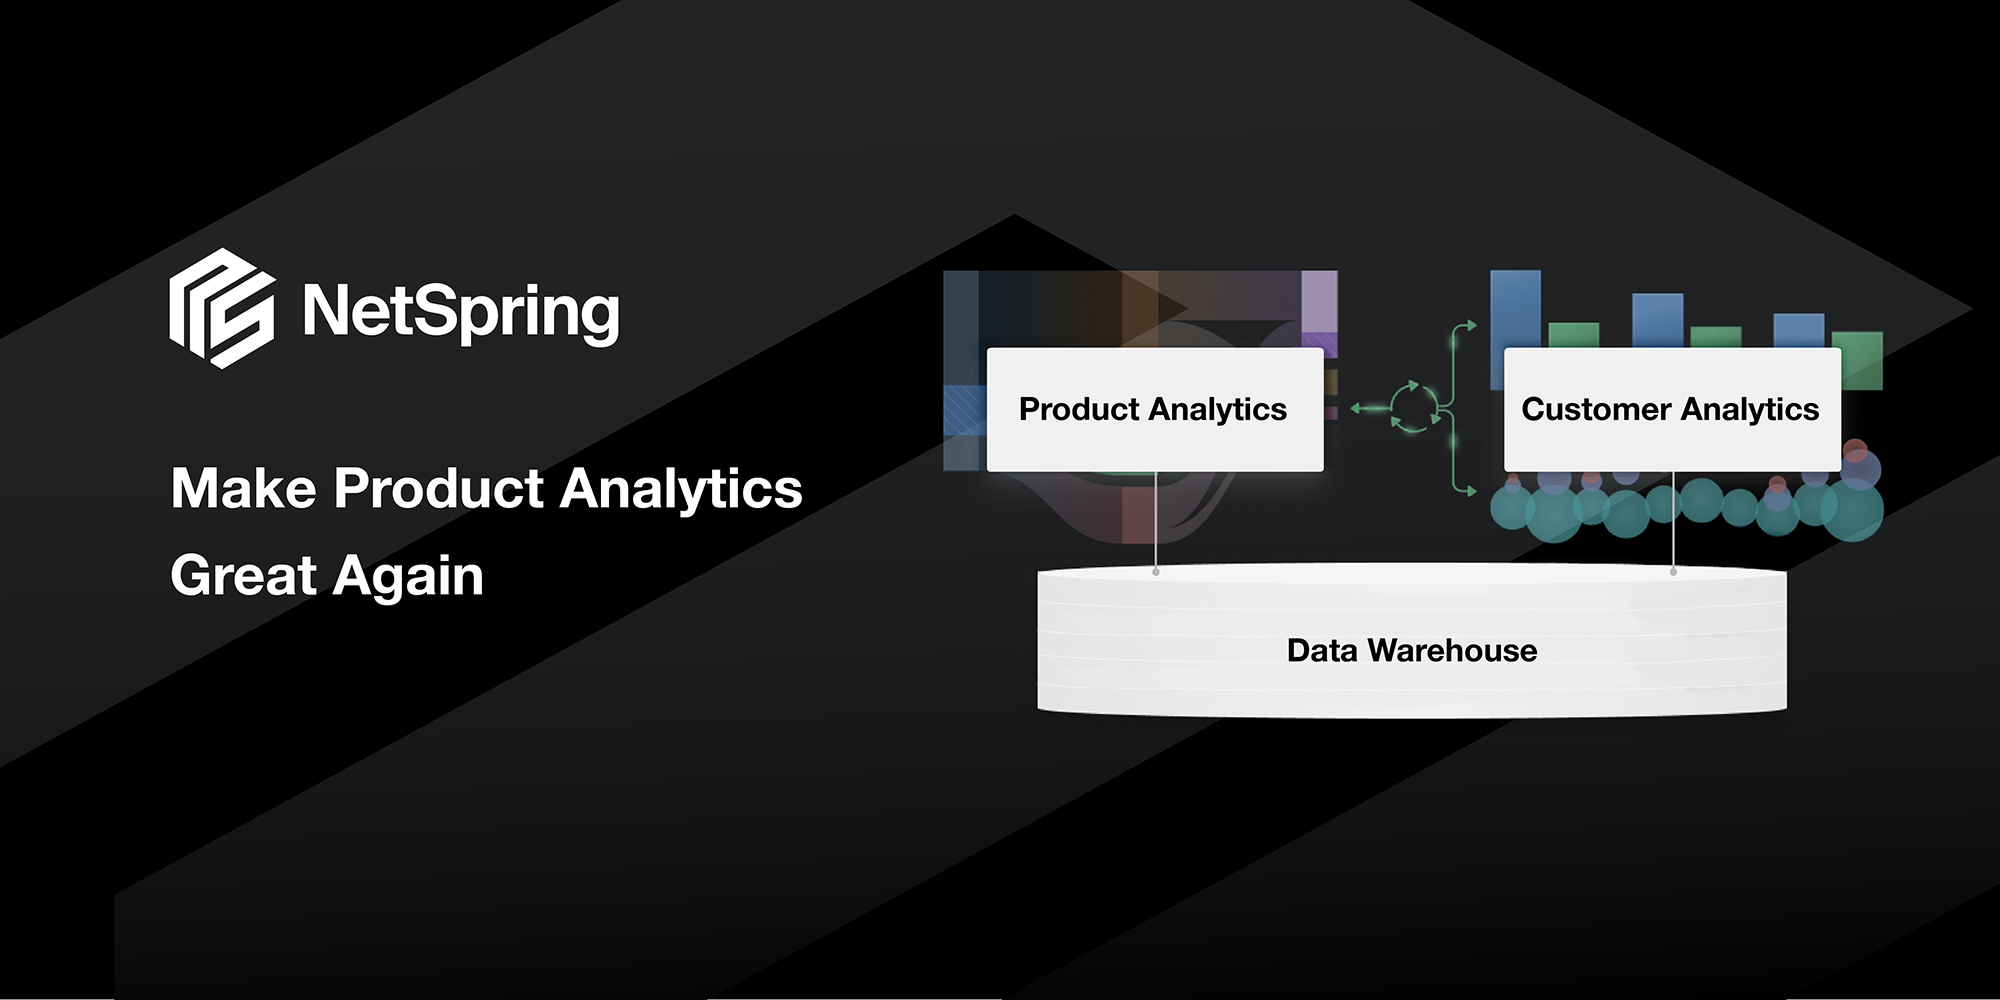
BI tools are designed for dimensional analysis of metrics with modeling artifacts like star and snowflake schemas. They are used primarily for reporting on state data (business transactions from POS, order capture, supply chain, sales, finance, HR etc.) in the warehouse. In companies where there is a large footprint of customer-facing digital products, there is also a need to work with event streams e.g. data from product/website/mobile instrumentation, IoT devices, wearables, marketing touchpoints, calls, chats etc. Historically this kind of data never reached data warehouses and analytics on this data was done in specialized SaaS tools such as marketing/web analytics, product analytics, digital experience analytics etc. This data and tools used to analyze this data were independent of the enterprise data warehouse and BI tools. As a result, the analytics is fragmented, lacking in richness, and unreliable. Increasingly, more and more of event data is coming into modern cloud data warehouses like Snowflake and BigQuery. NetSpring is the first tool to provide unified analytics on top of the data warehouses that can seamlessly handle event and state data – a single self-service tool with both BI and event data analytics capabilities. NetSpring’s template-driven UI provides the ability to do classic dimensional slice and dice of metrics, but also incorporate event sequences, behavioral cohorts, user journeys etc. For example, users can easily break down subscription revenue by multiple cohorts of users e.g. marketing targeted users, new users, highly engaged users etc.
NetSpring offers a rich library of UI-driven templates for generic foundational building blocks, use case-specific and domain-specific analysis. The foundational building block templates include modeling business entities, event streams, metrics, derived/formula columns, and cohorts. The higher level use case-specific templates include Event Segmentation, Funnel, Path, Impact, Retention, Correlation, Drivers, and a generic “Universal Exploration” template. The domain-specific templates are customizable per domain and customer e.g. Campaign Effectiveness, Feature Adoption, Product KPI, Session Engagement, Sales Funnel, Website Visitors etc. Templates can work hand-in-hand with Generative AI, with a LLM-driven “analytics co-pilot” helping users build with templates.

NetSpring offers a rich library of building blocks to compose any analytic computation of arbitrary complexity. Blocks offer the advantage of being UI-driven, eliminating the need for writing SQL – this makes it usable by business analysts; and it saves data analysts time from tedious SQL. Blocks also offer the advantage of being composable and reusable – this avoids many different definitions of the same thing buried inside 1000s of SQL statements. Users can build and publish blocks that can be used independently, but also used within other blocks for the next level of computation. Blocks generate an intermediate representation in a language called NetScript, which compiles down to optimized SQL for various data warehouses.

When you have a very large data scale, the typical challenge in traditional BI tools is poor query performance and high data warehouse costs. Oftentimes, data teams avoid providing access to a large number of business users to do ad hoc analysis because of the fear of runway queries and a high warehouse bill. NetSpring, with its expertise in high-volume event data processing, is designed to handle massive scale with innovative techniques like sampling and auto-materialization to provide the best cost-to-performance ratios. Users can self-serve for any ad hoc analytics with good response times and controlled costs. Data teams can freely open up access to NetSpring for everyone in the organization to self-serve.


Delivering on the promise of self-service
NetSpring can provide organizational agility through self-service BI, accelerating the time to analytical insights for business and data analysts – the key personas in ensuring data-driven decision making in companies. NetSpring solves one of the key missing pieces in self-service BI, and delivers on the promise of self-service analytics for everyone.
Try NetSpring today! Sign up today for a 14-day risk-free trial.


