NetSpring is a Product & Customer Analytics platform. ThoughtSpot is a Business Intelligence (BI) platform. In our customer engagements, we often get asked the question – when should I use NetSpring, and when should I use ThoughtSpot? This blog addresses the question and provides guidance on usage of both tools.
Below is the comparison of the two tools based on capabilities and the type of analytics done by business and data teams.
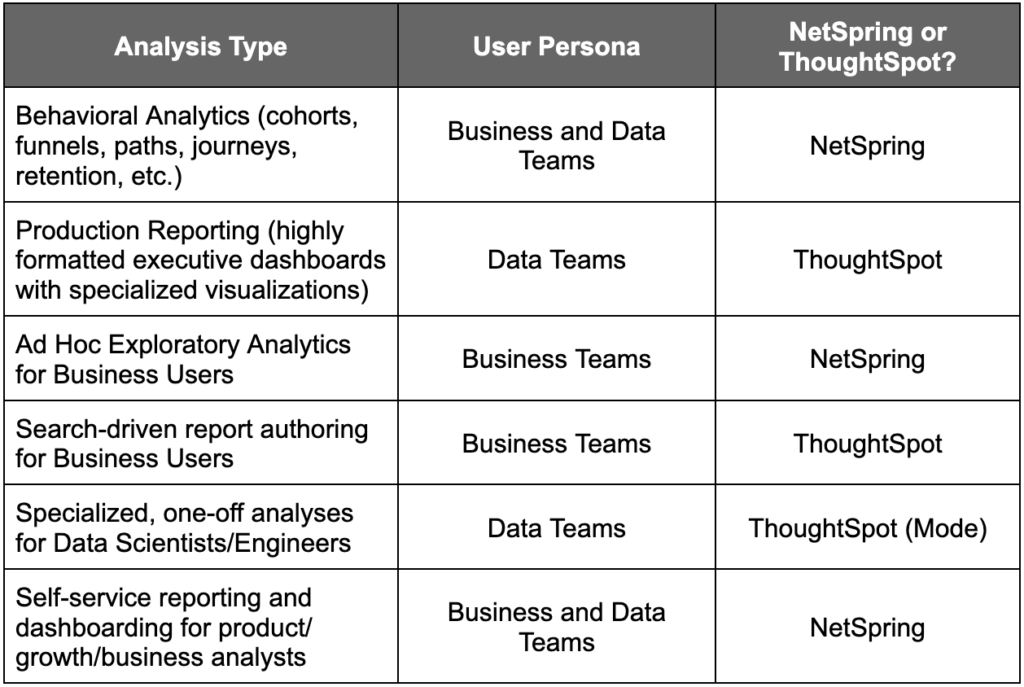
Let’s look at each row individually.
Behavioral Analytics
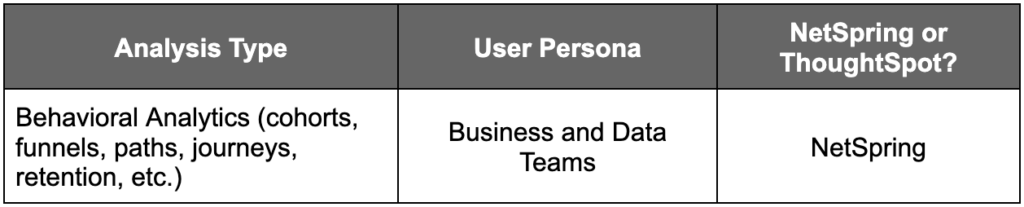
NetSpring offers a rich set of UI-driven templates purpose-built for behavioral analytics that can be used by business users and data engineers without the need to write any SQL. NetSpring optimizes queries to the data warehouse for the best cost/performance ratios. All reports generated by NetSpring are interactive, to iteratively do deeper and deeper analysis.
ThoughtSpot is not designed for behavioral analytics because it is not an event-oriented platform. Behavioral analytics in ThoughtSpot has to be done by writing SQL which is very complex and cumbersome to build and maintain. ThoughtSpot has no native understanding of time series, cohorts, funnels, etc. to optimize queries, resulting in poor performance and high warehouse costs. Even if a visualization can be (painfully) constructed in ThoughtSpot using SQL, it is not interactive. Each follow-up question results in a request to the data team to build a new ThoughtSpot report.
Production Reporting
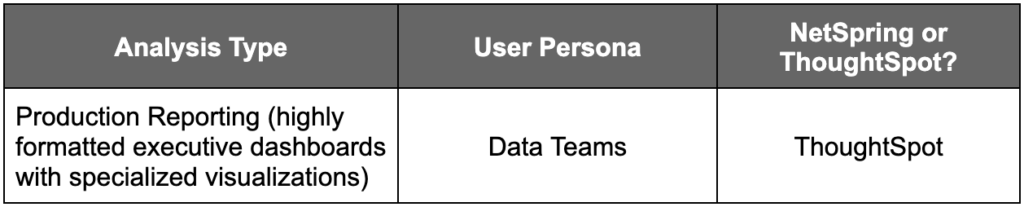
ThoughtSpot is fundamentally a reporting tool built for production reporting.
While NetSpring has a rich reporting and dashboarding layer, it does not yet have some of the visualization capabilities such as Geo maps, advanced pivot tables, financial reporting, scheduled report distribution, etc.
Ad Hoc Exploratory Analytics
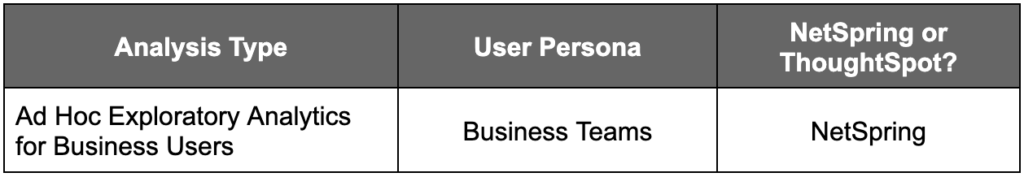
NetSpring’s specialized behavioral analytics templates, rich library of modeling templates, and generic visual exploration interfaces allow for self-service ad-hoc data exploration by business users without the need to write SQL.
Search-Driven Report Authoring
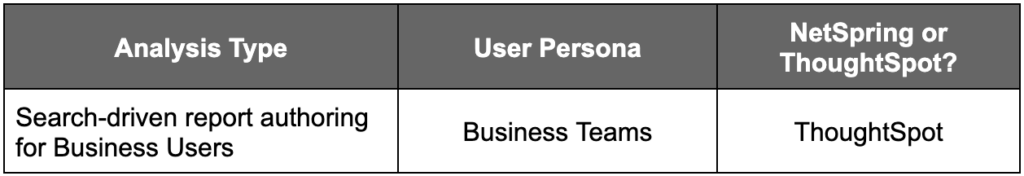
ThoughtSpot is the pioneer in search-driven BI, where a business user can express an analytical question using a search interface, to produce a report easily.
Specialized, One-Off Analyses
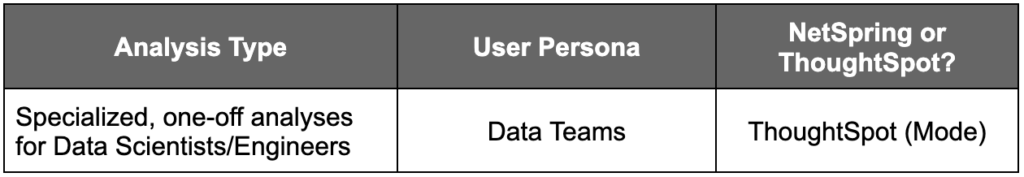
ThoughtSpot’s Mode (acquisition), is designed for SQL-savvy data scientist/engineering teams that require the full power of SQL for specialized, one-off analyses.
NetSpring offers full SQL support and a powerful scripting abstraction over SQL, called NetScript. However, it does not offer collaboration and lifecycle management of SQL queries.
Self-Service Reporting
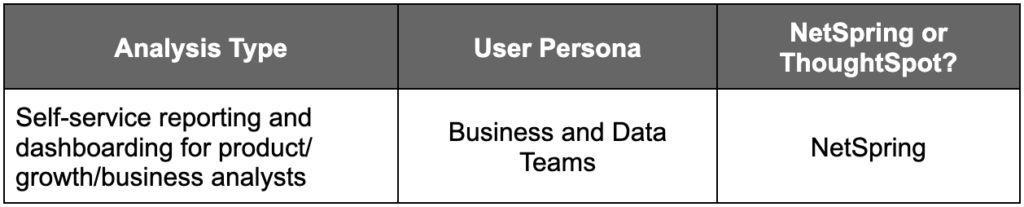
NetSpring has rich self-service reporting and dashboarding capabilities, with the additional advantage of seamlessly incorporating behavioral analytics into dimensional reporting e.g. take a cohort of users that dropped off between two stages of a funnel and break up metrics for that cohort by various dimensions. In scenarios where business teams have the need for behavioral analytics, BI reporting and dashboarding in the same tool, NetSpring serves as that single integrated tool. Note that in this scenario, NetSpring is also used by data teams that may be helping business teams build more advanced analysis, with the advantage of being able to collaboratively build in the same tool.
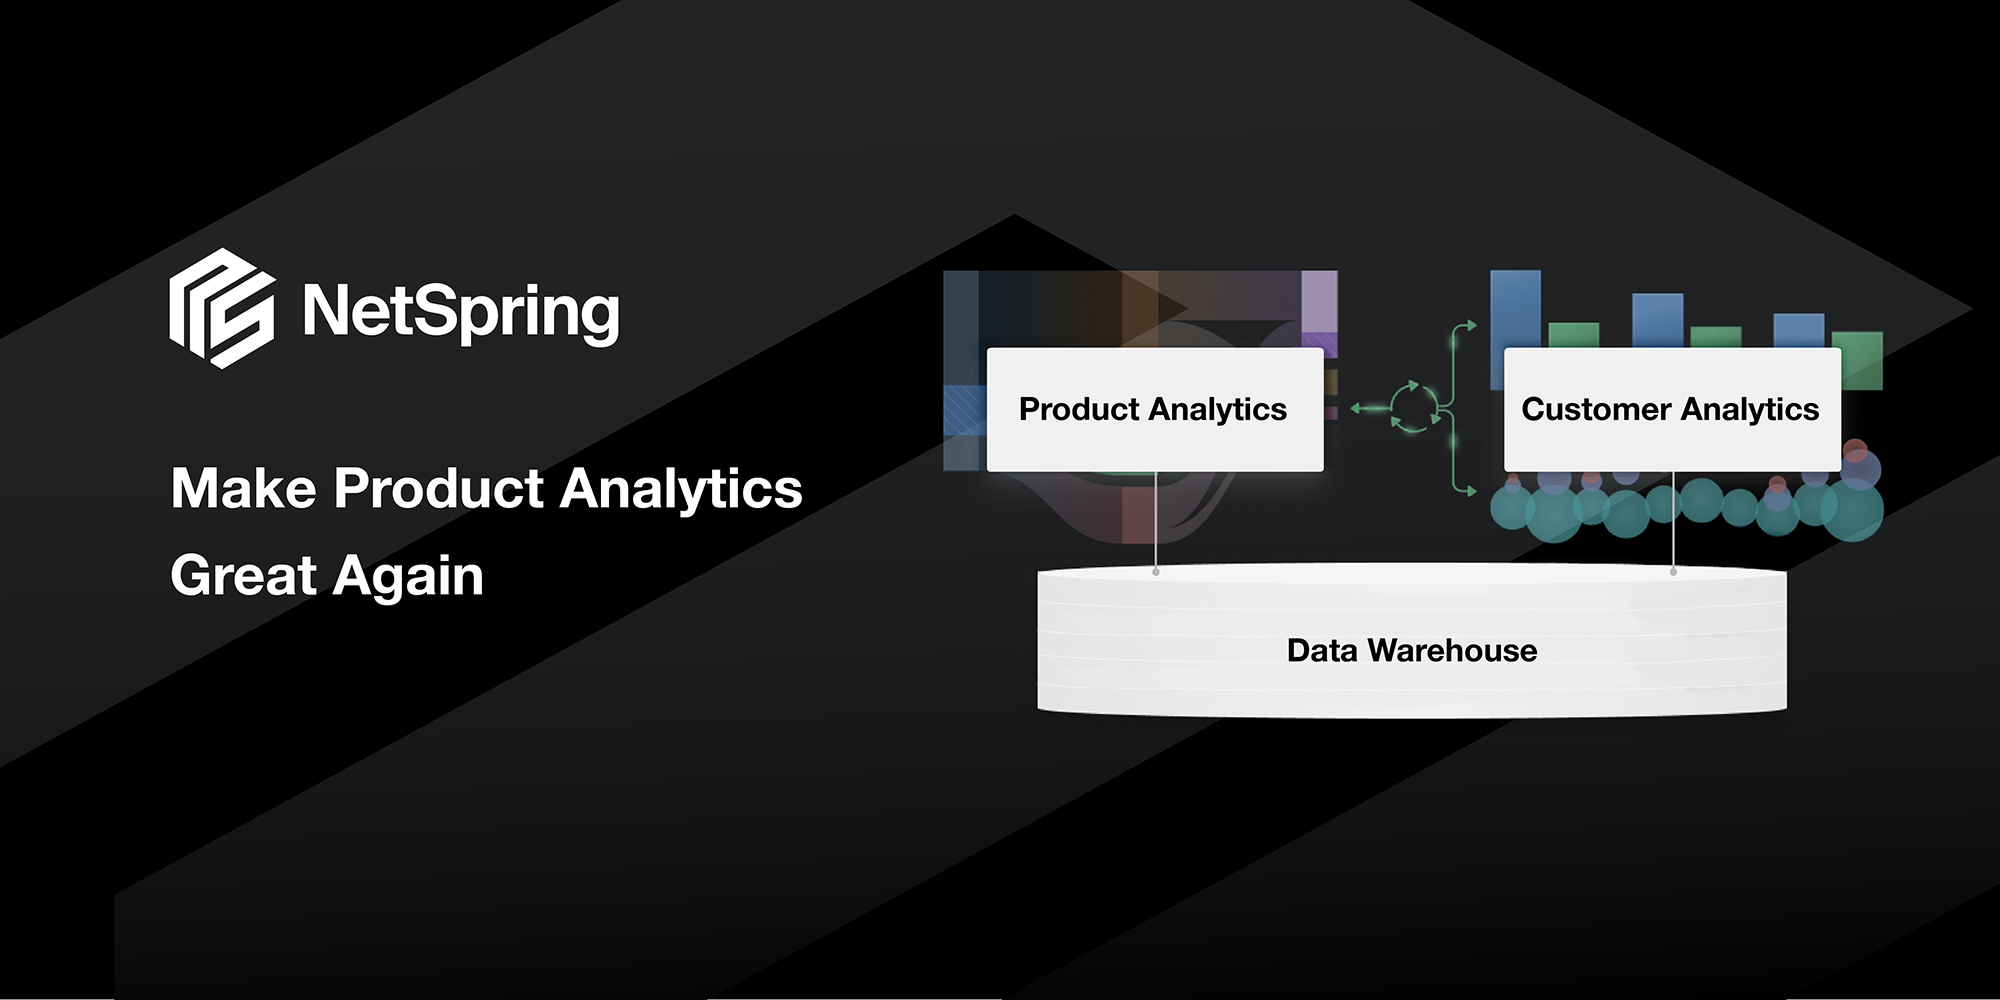
The convergence of Product Analytics and BI
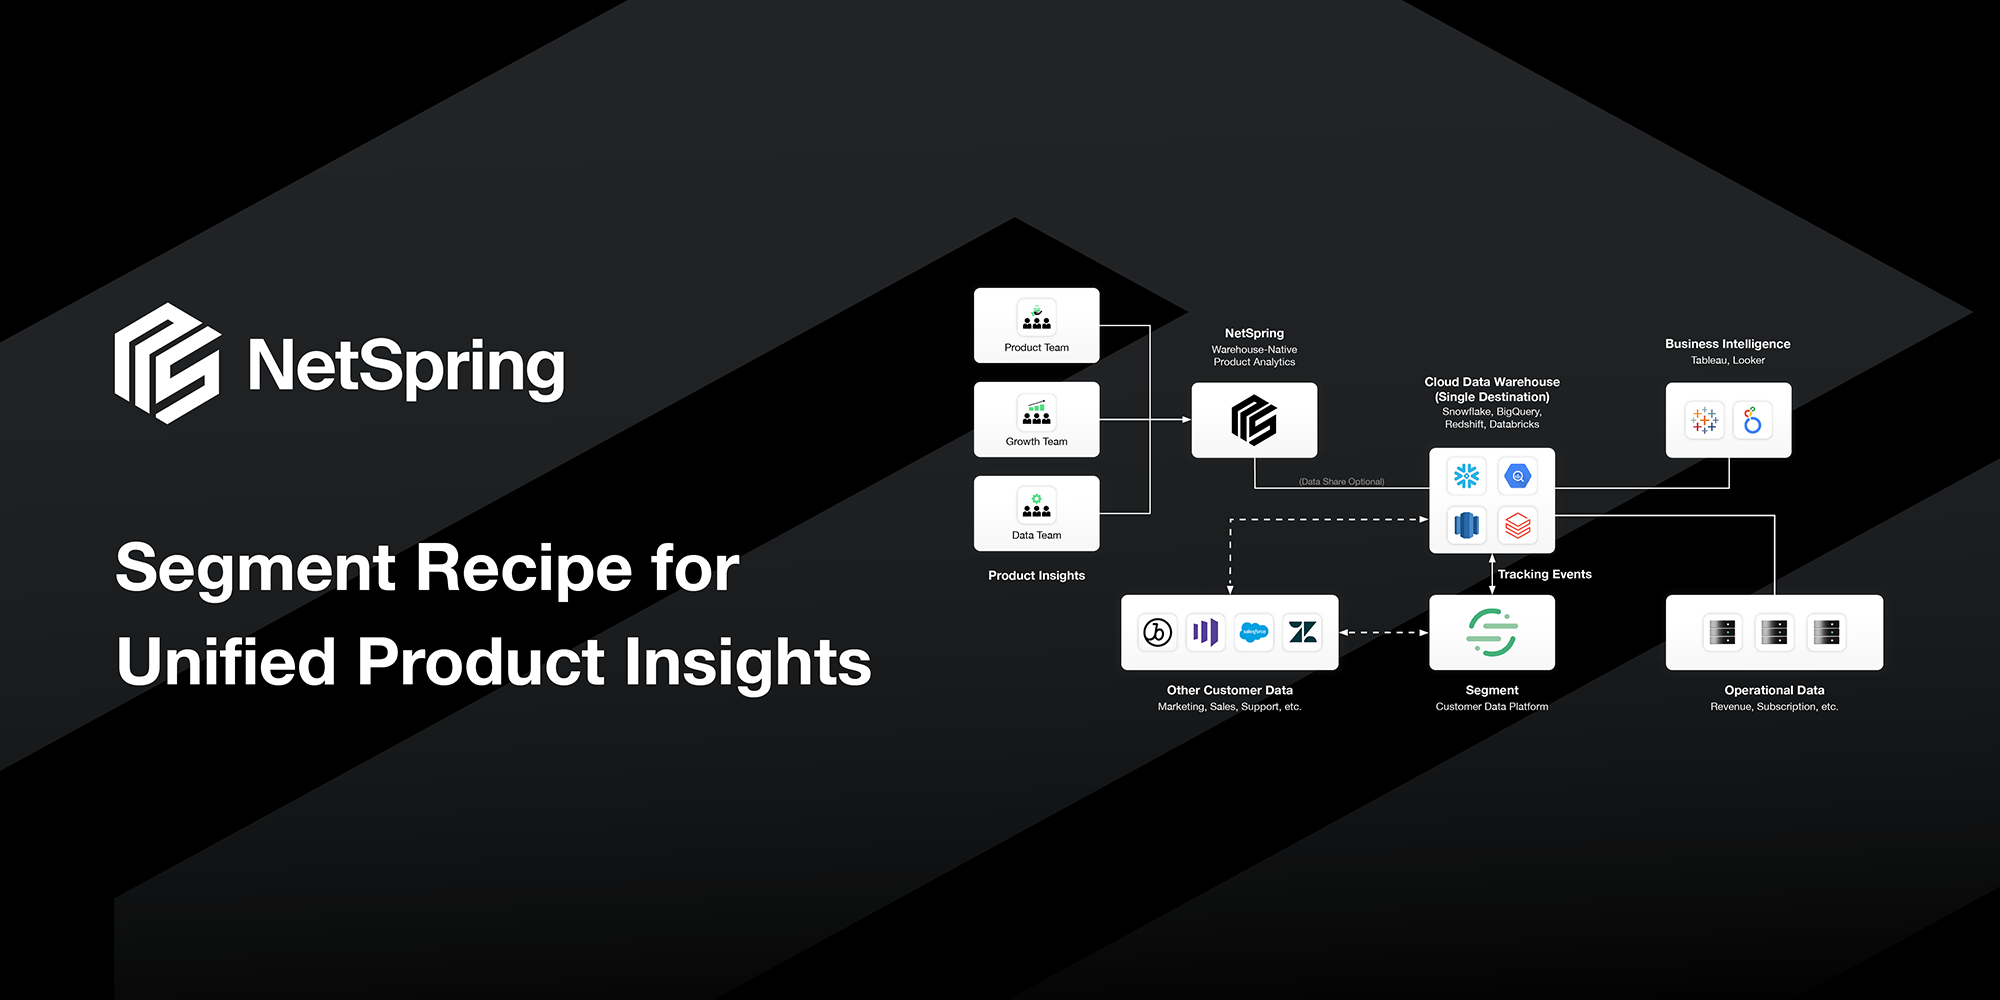
The challenge until now, is that Product Analytics and BI have been separate systems. When a user in a first-generation product analytics tool has the next level of questions, they have to call their data engineering teams to build them a one-off report in a BI tool. The data engineering team has to export data from the product analytics tool into a data warehouse and write cumbersome SQL to produce the report – this could take weeks. Furthermore, you now have fragmented analytics in two separate systems that cannot be used seamlessly.
At NetSpring, we architected our system from the ground up for the Modern Data Stack. We have designed an architecture that bridges the worlds of event- and state-oriented systems. We did this by starting with a traditional relational model, and layering an event model on top. The traditional relational model enables BI-style dimensional slice-and-dice analyses from a self-service product analytics platform. Read this blog to learn more.
The evolution from Product Analytics to Customer Analytics
First-generation product analytics tools like Mixpanel and Amplitude emerged a decade ago when mobile apps and SaaS services became pervasive, and BI tools, Customer 360, and data warehouses weren’t yet up to the task. It quickly gave Product teams an understanding of user behavior within the product, and helped them to improve product features. Unfortunately those tools were siloed with only product instrumentation data, limiting their value to product and feature-level metrics. No significant business-impactful decisions could be made – and certainly not ones the C-Suite cared about.
As software is increasingly being consumed as subscription SaaS services, cross-functional product-led growth teams are now looking to eliminate the product analytics silo and combine product and customer business data (sales, support, finance, marketing, success, etc.) for a shared, consistent, 360o view cutting across all customer touch points – in-product or outside the product, for business-impactful analytics. Read this blog to learn how, with advances in cloud data warehouses, we’ve come full circle with Customer Analytics.
At NetSpring we are working hard towards this Customer Analytics vision. If you want to see how, watch a demo here. And getting started is free and easy!