You are a product-led business that is expanding rapidly. Your business methodology is Product-Led Growth (PLG), where user acquisition, conversion, engagement, retention and expansion are product-driven. As a result, your Product, Growth, Marketing, Sales, and Success organizations are all craving for more product and customer analytics to understand and influence key drivers of business goals.
Your team has been tasked with coming up with an analytics strategy for the enterprise – architecture to adopt and tools to use. Do you build in-house or do you buy from external vendors? This blog talks about the modern architectural pattern to employ, and the pros and cons of build-versus-buy of tools for product analytics.
Analytics Architecture
The following principles are core in the architecture of a modern data analytics stack:
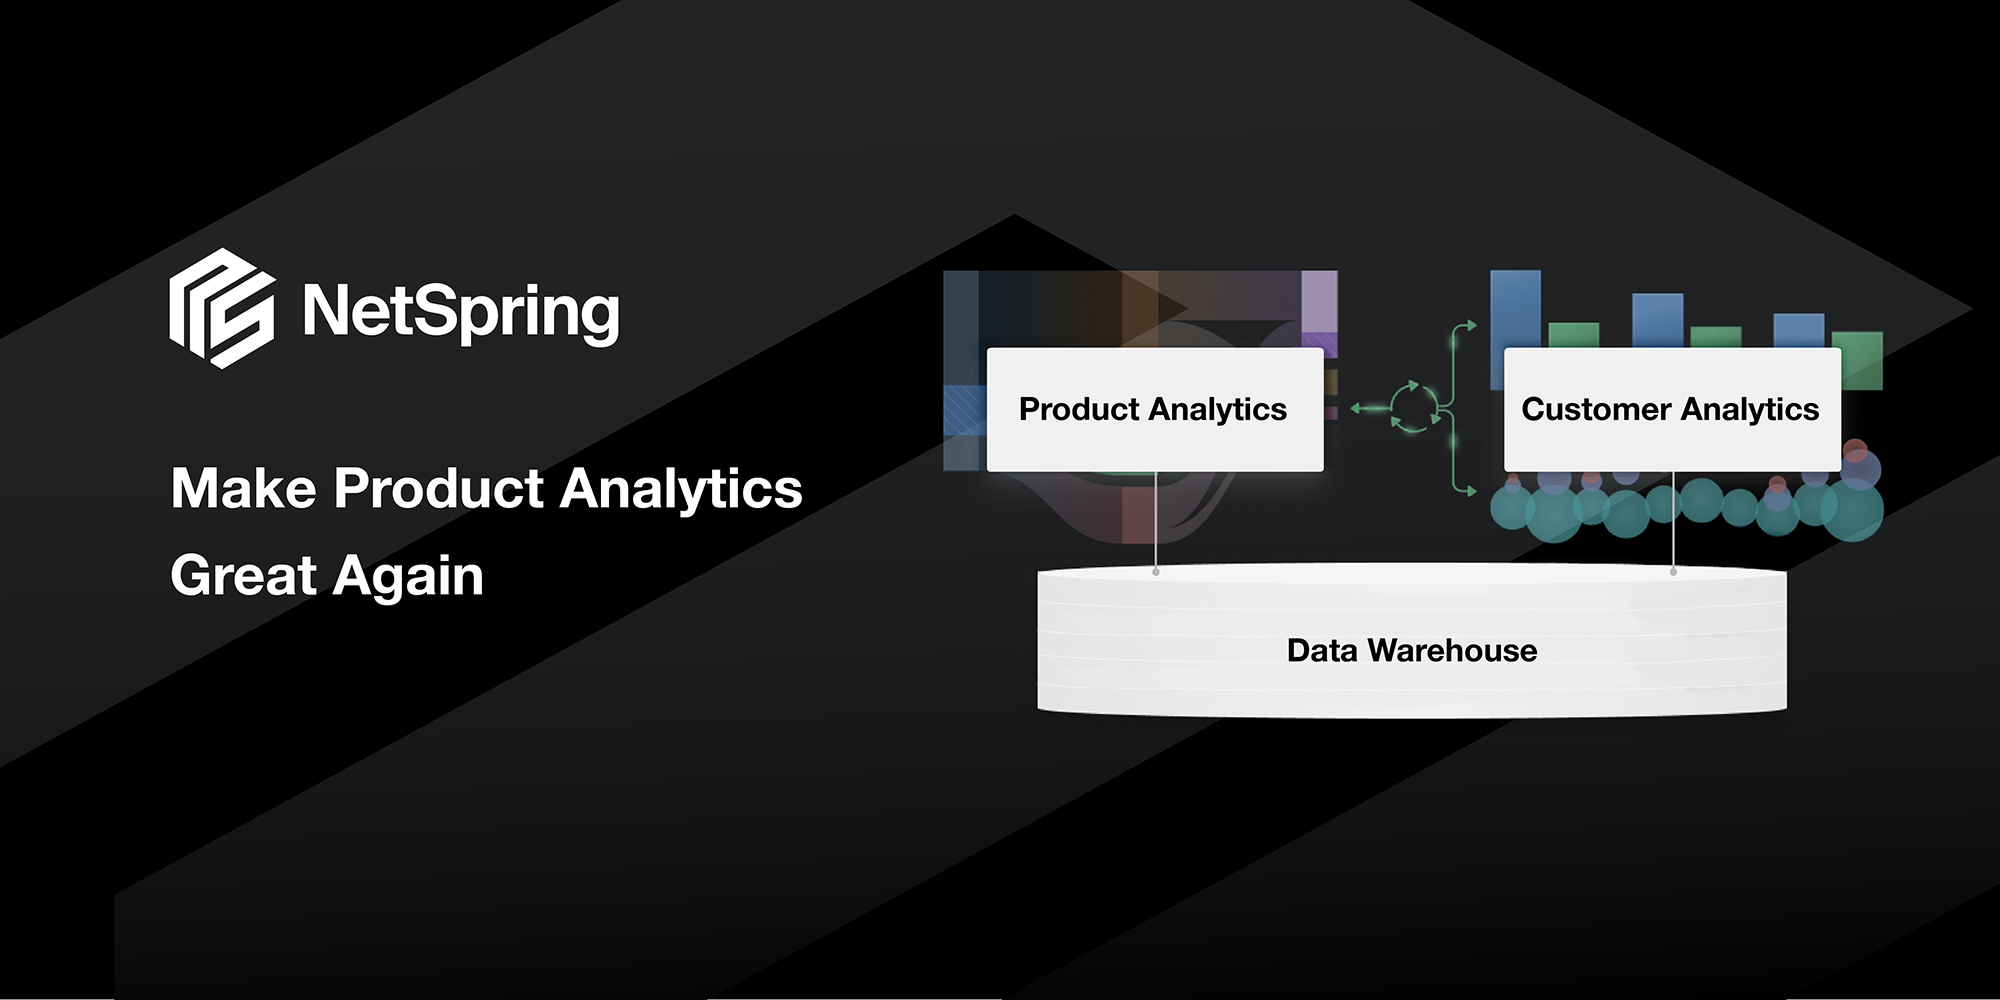
- Warehouse Centricity: The data warehouse is the central repository of all data, including product instrumentation data and data from business systems.
- ELT (Extract, Load, Transform): Use of ELT as opposed to ETL. Data transformations occur in the warehouse using warehouse-centric tools like DBT. Raw data, such as event data, is stored in the warehouse in native form and available for consumption in raw or transformed forms, depending on what the consuming client needs. No dropping of any data or loss of data fidelity.
- Decoupled Instrumentation: Product instrumentation SDKs and libraries are decoupled from analytics tools. Use of best-in-class tools like Segment, Snowplow and Rudderstack to instrument products and apps, and land that data directly in the central enterprise data warehouse. This data is in an open format, stored in familiar relational models in the warehouse, that any analytics tool can easily consume.
- Warehouse-Native Analytics: All analytics tools should connect to the warehouse and work directly off that data. No data should be copied out of the central data warehouse – critical for cost, security, governance, accuracy, and manageability reasons.
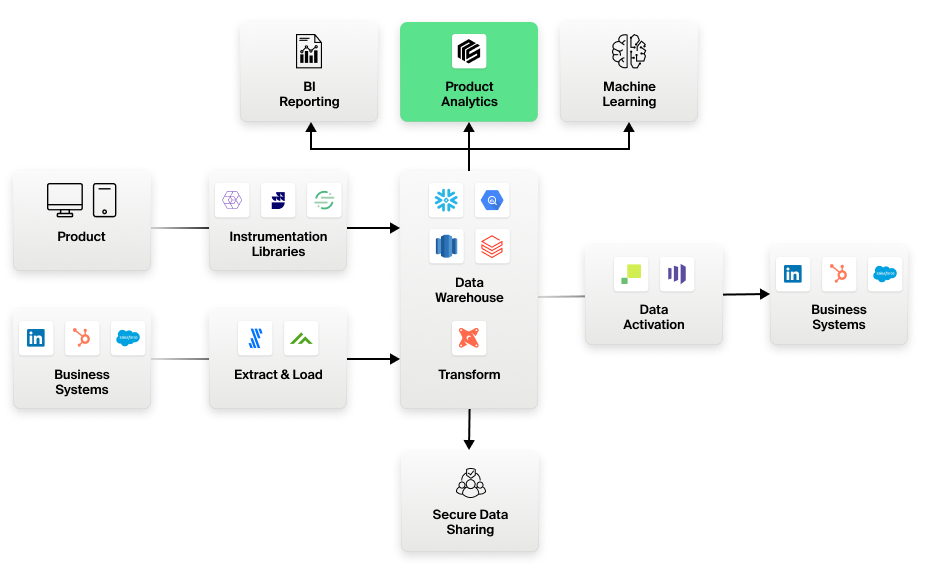
Figure 1: The Modern Data Stack for analytics
Build versus Buy
Assuming that you subscribe to the architectural patterns described above, let’s understand what build versus buy looks like for product analytics. Here are some scenarios you might have thought of:
Build Scenario 1:
I realize product analytics is very specialized. But we are a tech-savvy company that builds complex products. We can build a product analytics tool ourselves.
Pros
- Full control over tooling that can be tailored for your business needs.
- No additional costs of licensing external products.
- No security, compliance issues with data movement or using external SaaS services.
Cons
- Massive investment with a large team to build such a specialized, complex tool. May cost many times more than licensing a product that is focused exclusively on analytics.
- Risk of product decay and sunk investment if core members of this team leave the company.
- Lost opportunity of using the product analytics tool investment elsewhere where it may be more core to your business.
Build Scenario 2:
My data engineering team has strong SQL skills. I can do this with SQL tools like Mode or Notebooks.
Pros
- Low cost of SQL editor tools.
- Data engineers can tailor specialized analytics using SQL that they are used to, and strong at.
- Basic visualization that these tools offer may be good enough for your consumers.
- SQL tools work directly off data in the data warehouse. So they conform to the modern architectural pattern you subscribe to. Can trust the analytics since they work directly off the master data in the warehouse and not some copy.
Cons
- Business users cannot self-serve for analytics and have to rely on, and wait for, data analysts to build reports for every request.
- SQL for product analytics queries is unscalably complex and cumbersome to write and maintain. Huge load on data analysts with repeated requests from business.
- Specialized visualizations and modeling constructs such as time series, cohorts, funnels, and paths are not available in plain SQL tools.
- Reports produced are not interactive for the next level of analysis e.g. drilling into users who dropped off between two stages in a funnel.
- Raw SQL for product analytics queries do not perform and can be unusably slow. Analysts have to work with data engineering teams for cubing, tuning, pre-processing, sampling etc, to work around performance issues.
Build Scenario 3:
I already have Tableau. I’ll just use that for Product Analytics.
Pros
- No new spend as a result of using a tool that has already been paid for.
- No new tool to learn as a result of using a familiar tool that is already in use.
- BI tools like Tableau work directly off data in the data warehouse. So they conform to the modern architectural pattern you subscribe to.
- Can trust the analytics since they work directly off the master data in the warehouse and not some copy.
Cons
- BI tools are not suitable for expressing event oriented product analytics queries that involve cohorts, sequences, paths, flows, and time series. So business users can’t self-serve and have to rely on data engineering.
- Data engineers have to work with low-level SQL. SQL for product analytics queries is unscalably complex and cumbersome to write and maintain. Huge load on data engineering teams with repeated, often mundane, requests from business.
- BI tools don’t perform for product analytics queries and can be unusable for many use cases. Data engineering has to invest in cubing, tuning, pre-processing, sampling etc, to work around performance issues.
- Interactions in BI reports are limited to traditional dimensional drilling and do not understand product analytics semantics e.g. drilling into users who dropped off between two stages in a funnel, and seeing all paths they took before dropoff.
Buy Scenario 1:
Let me play it safe by picking a traditional first-gen tool like Amplitude that has been around more than a decade.
Pros
- Low risk by purchasing a traditional tool that is mature and known to work.
- Can find people who know how to work this tool since it has been around a long time.
- Business users can self-serve with simple templated reports purpose-built for product analytics.
Cons
- Build and maintain costly ETL jobs to move data from the warehouse to first-gen product analytics tools, since these tools can’t work directly off the data warehouse.
- Violates your core architectural principle of warehouse centricity and data not moving out of your enterprise store. Security and governance risk exposure with critical customer data going off to a vendor’s black-box SaaS service.
- Numbers often don’t match between Tableau and Amplitude because they are working off different copies of data. Weeks spent in reconciliation of conflicting numbers. Don’t trust the numbers in the product analytics tool because it is often working with stale or incomplete copies of the master data in the warehouse. Can never put this in front of the C-suite.
- Event-based pricing of product analytics tools like Amplitude makes it prohibitively expensive. No easy way to delete unused events. You unnecessarily pay for events whether anyone uses it or not. Huge effort every month to figure out what events to send to the product analytics tool (and what not to), to control costs.
- Since the first-gen tool was designed with a specific data model and a single-table compute system, you cannot go beyond basic templated reporting. Ad hoc exploratory analytics, particularly with additional business context such as Accounts, Contracts, Tickets, Support Calls etc. is impossible to do. As a result, data from the tool has to be ETL-ed out to the data warehouse for further analysis by data engineering teams. Additional ETL headaches.
- Business teams start with the first-gen tools but quickly hit a wall; have to call upon data engineering to export data out and write custom, one-off reports that could take weeks. You end up with fragmented analytics in two separate systems.
Buy Scenario 2:
I want to buy a next-generation product analytics tool that doesn’t force me to move data out of my data warehouse.
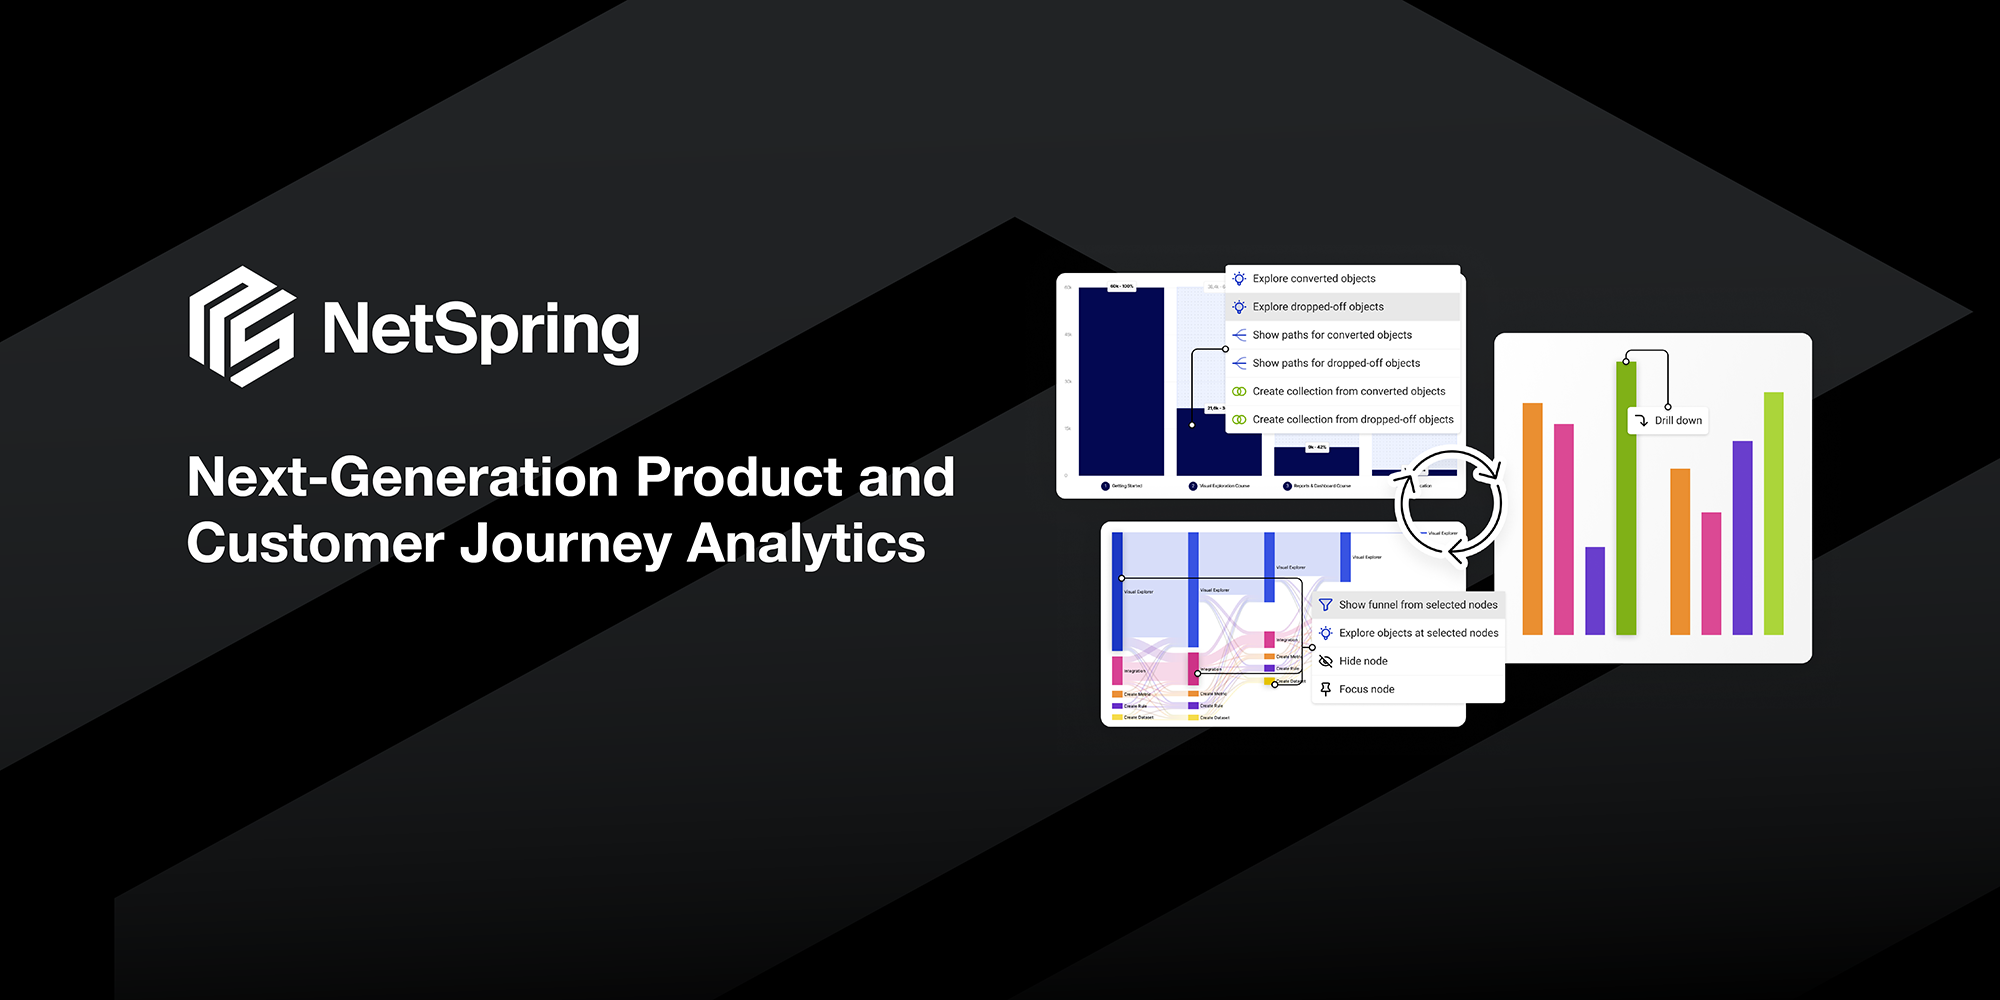
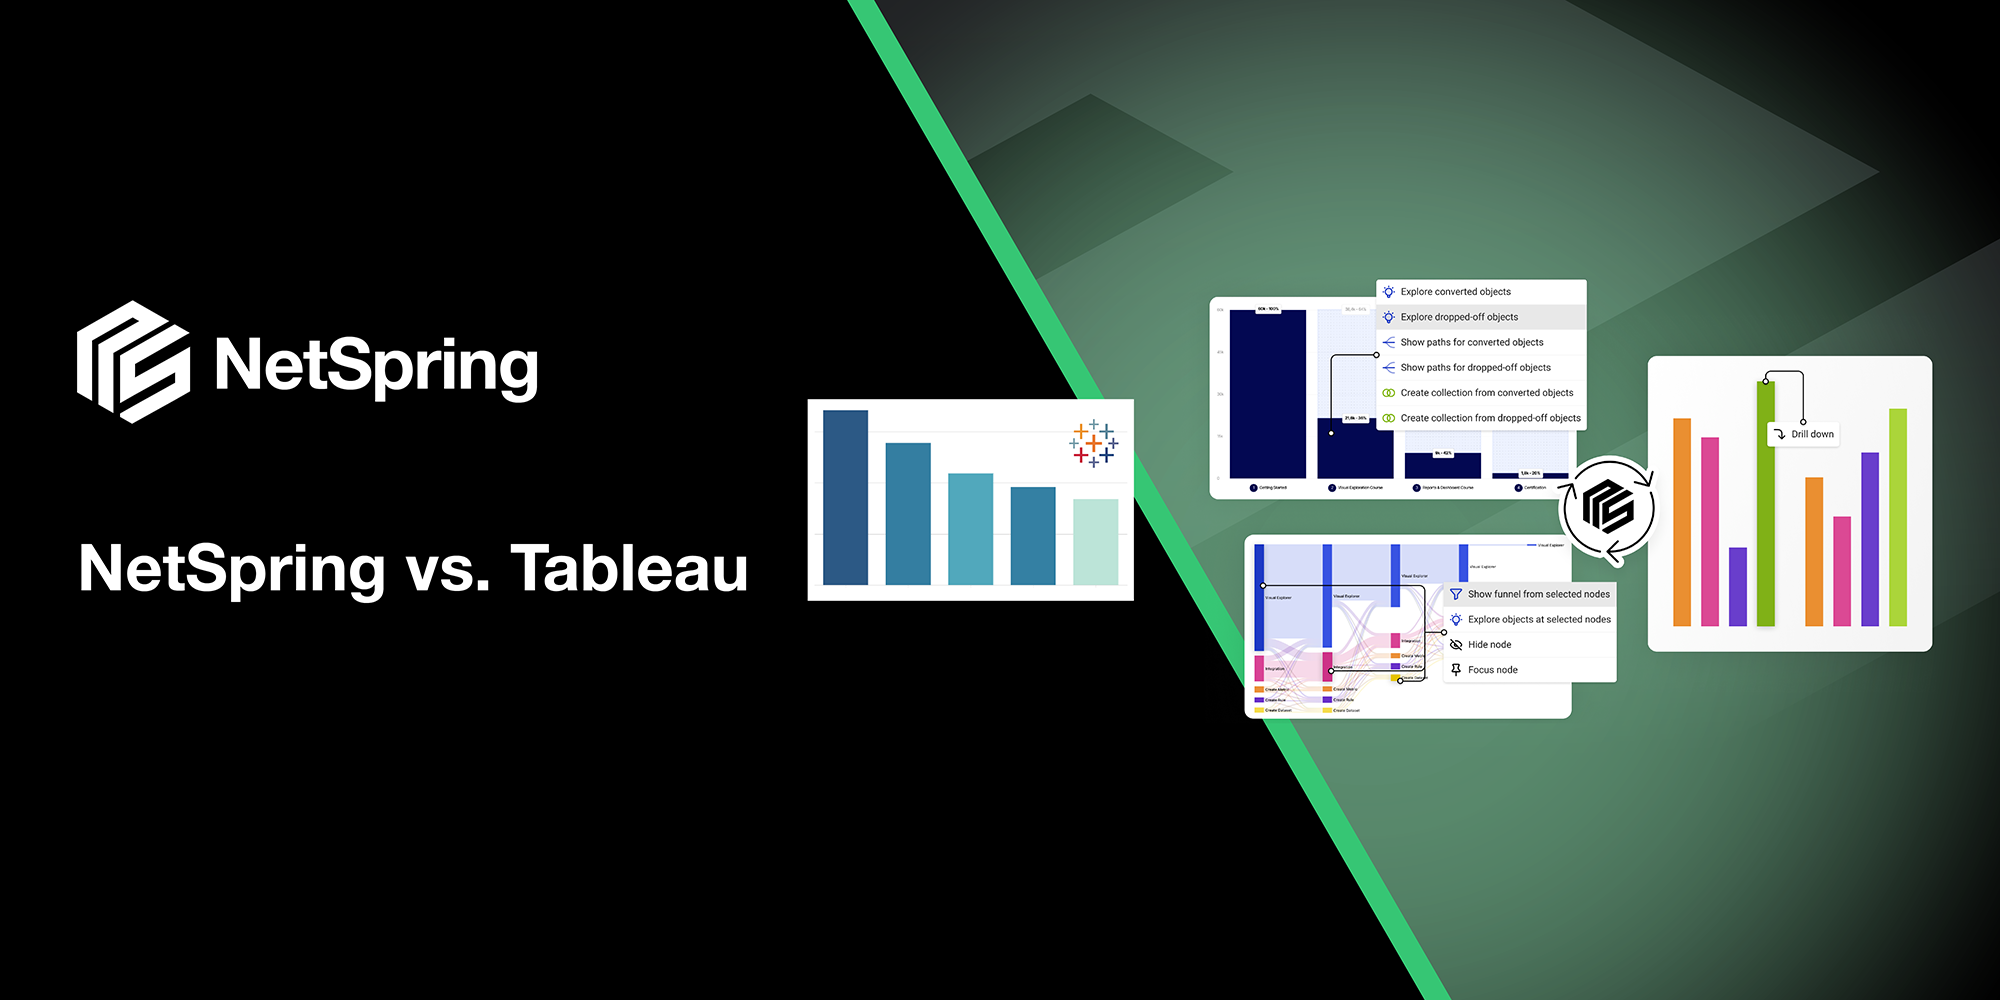
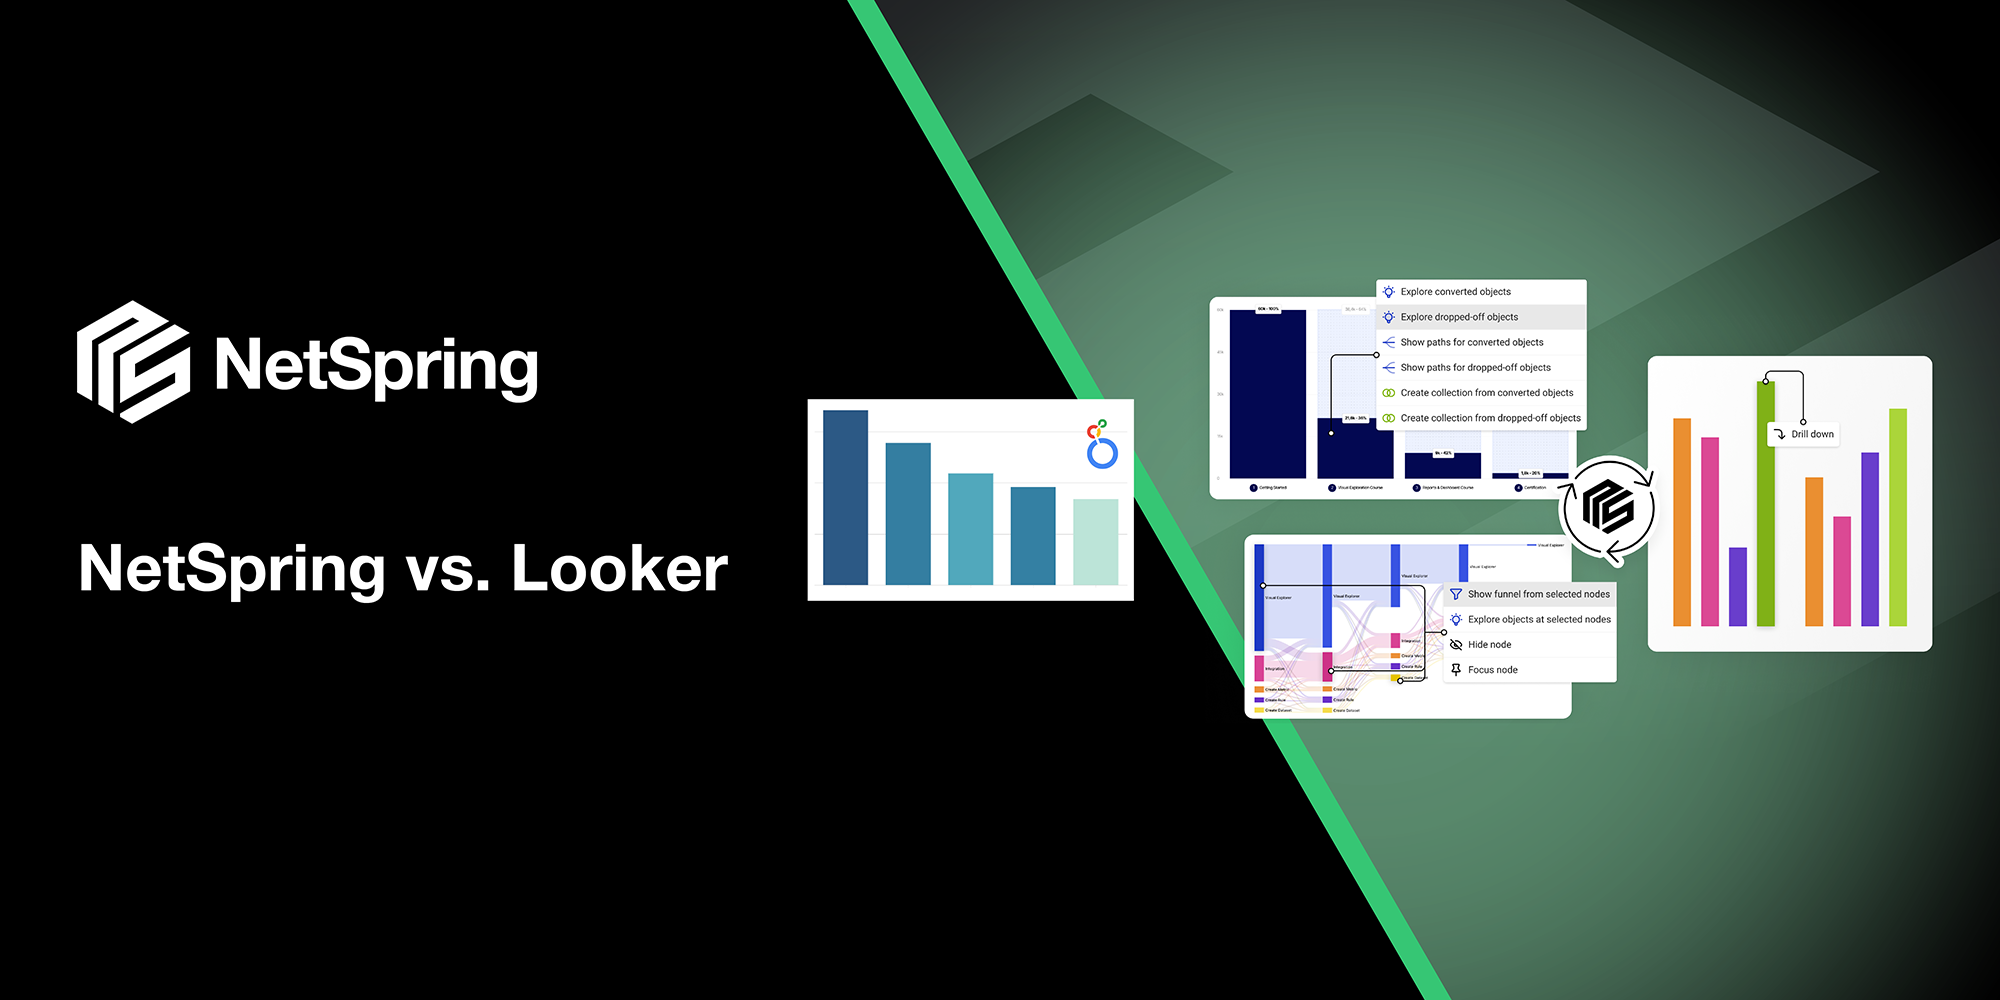
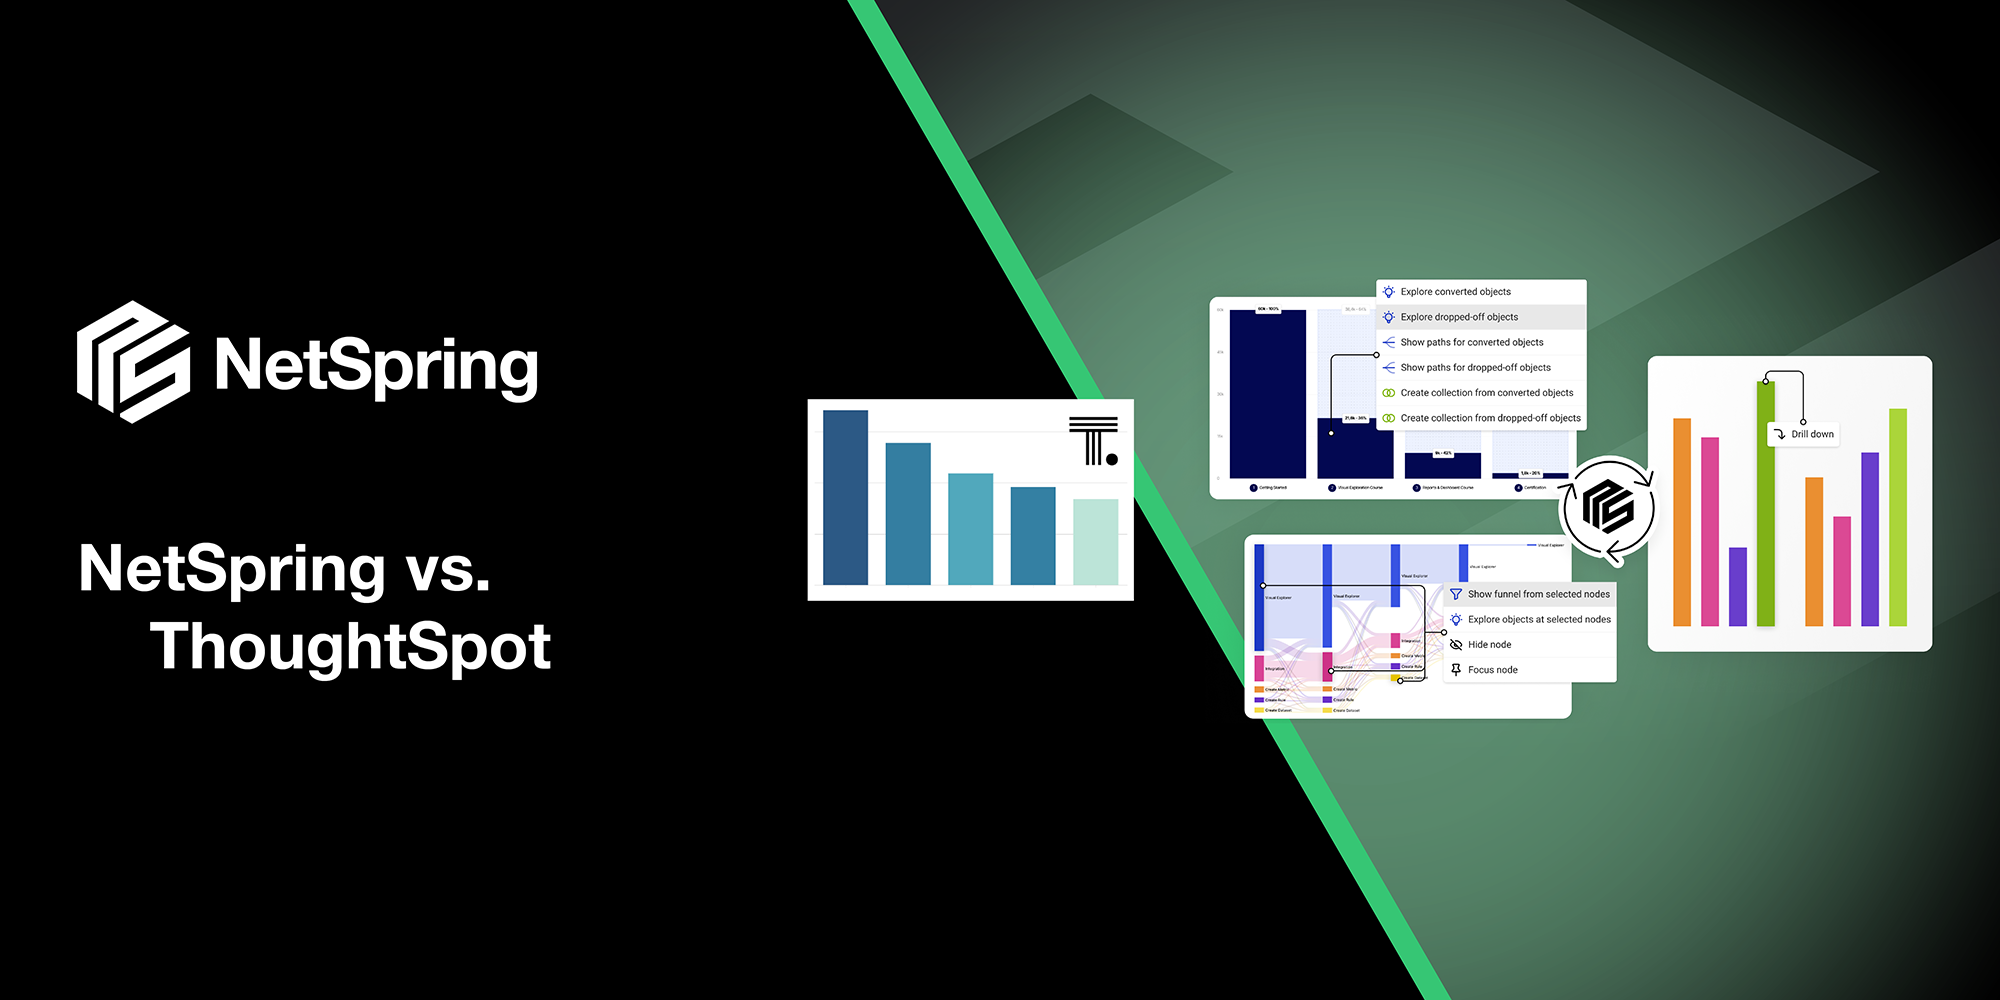
Check out NetSpring for a self-service product analytics tool that doesn’t force you to move data out of your data warehouse. We are the first truly warehouse-native product analytics platform – no data ever leaves your secure data warehouse.
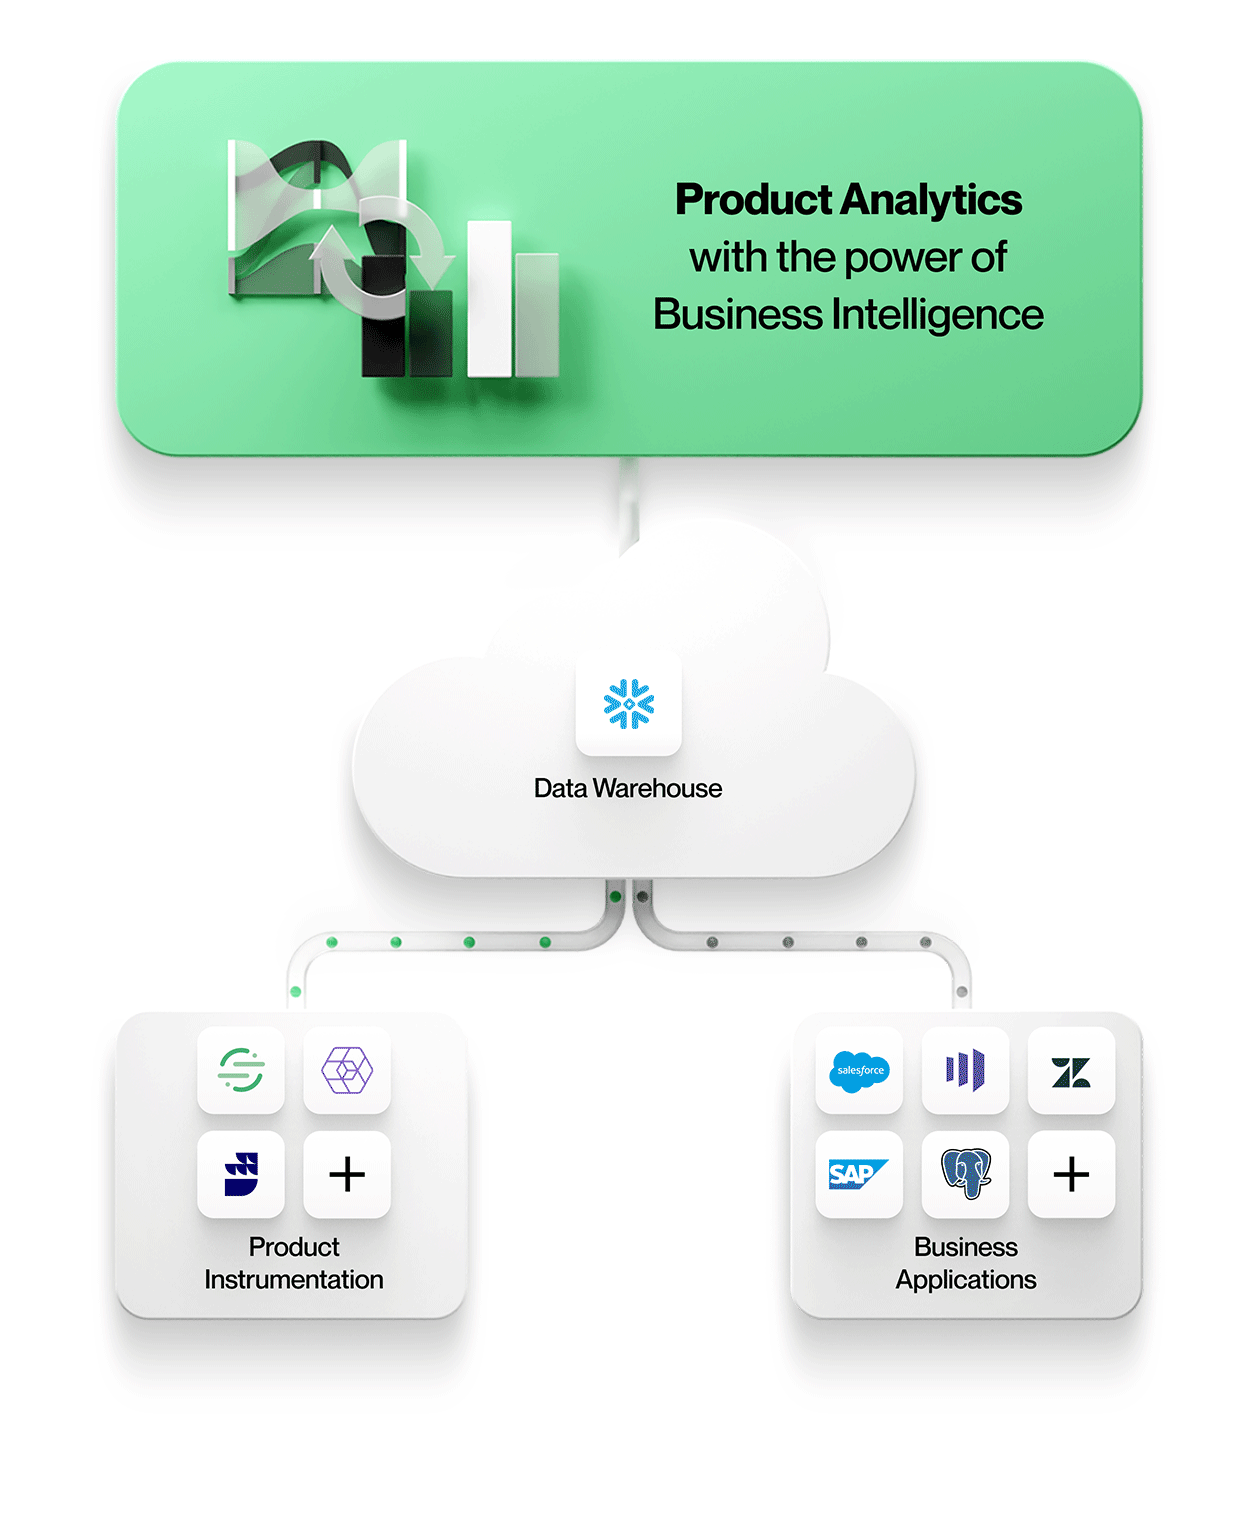
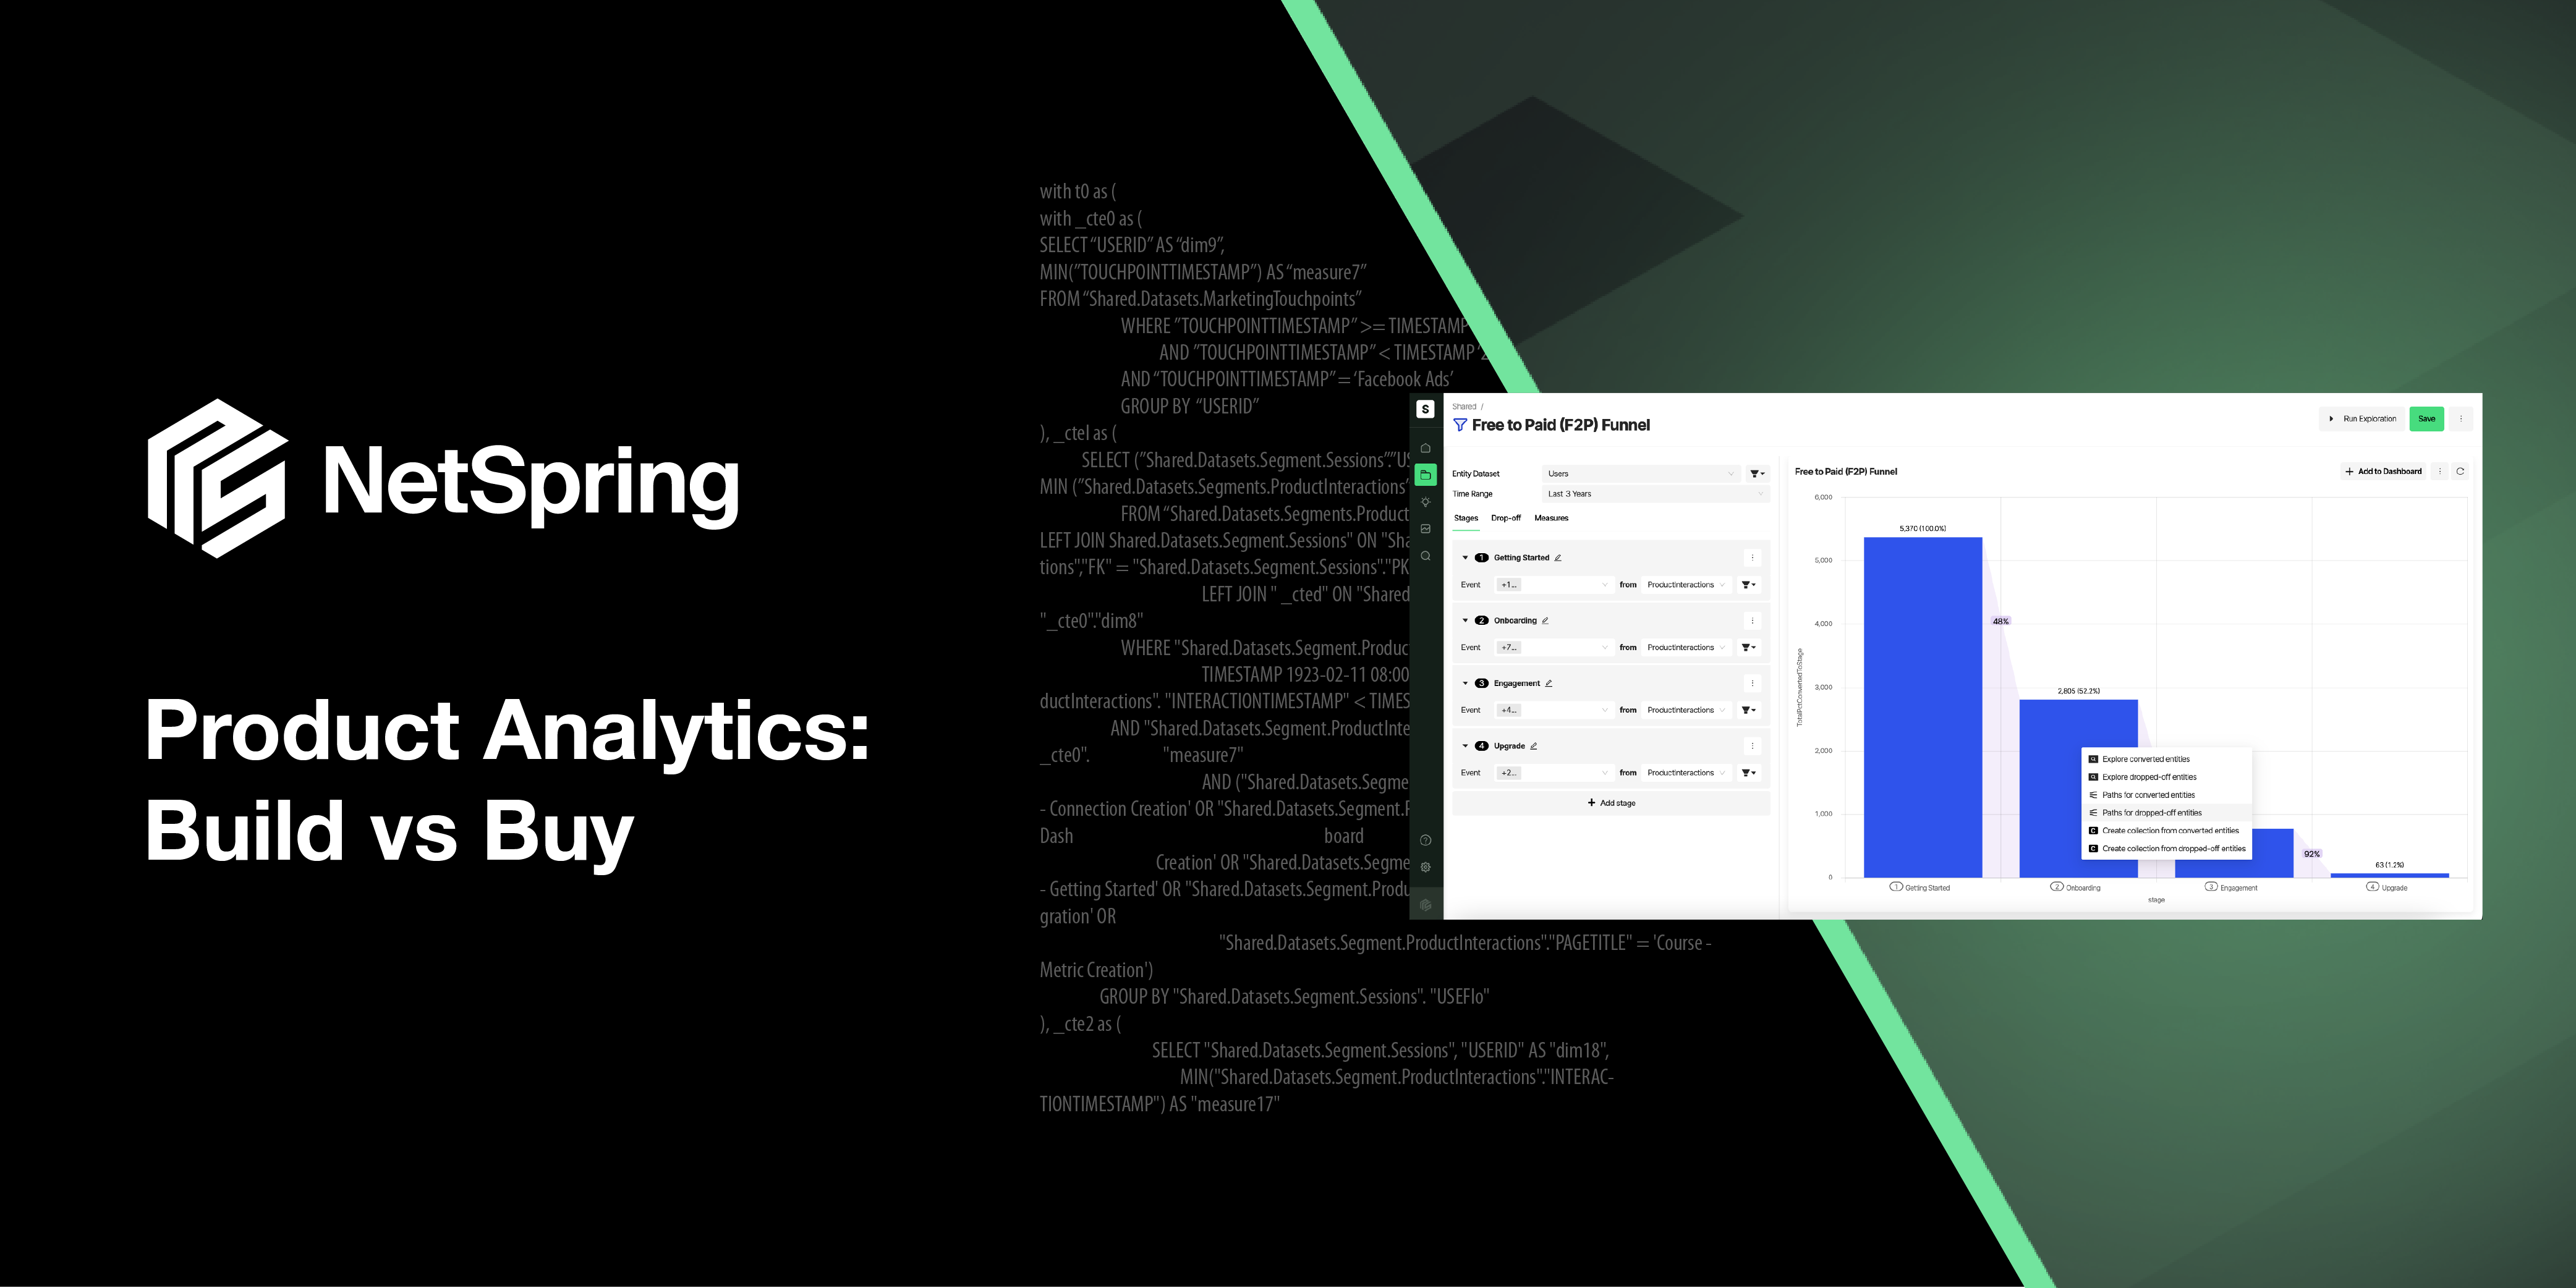
Figure 2: Next-Generation Product Analytics with NetSpring
NetSpring brings the ad hoc analytical power of BI to the world of product analytics. With rich product analytics templates and visual ad hoc data exploration capabilities, NetSpring enables business users to self-serve for even their advanced needs. Build complex funnels across event streams with conditional stages, all in a no-code environment, versus writing pages and pages of gory SQL.
Watch Video: Comparing NetSpring vs. SQL development for building a 4-stage funnel and then adding a filter
NetSpring automatically generates elegant SQL for the most sophisticated product analytics queries, and also empowers power analysts and data engineers with full SQL support and advanced scripting capabilities. But most of your most sophisticated questions are easily answered within the fully self-service platform.
Sounds too good to be true? Get a live demo today.