
Founders and technical leads are often searching for the perfect data analytics stack that will just work and meet all their needs. The reality is, needs change as companies grow, meaning that an analytics architecture should adapt, too. In this post, I’ll chart the analytics journey from the earliest stages in your company when you might still be working out of the garage, to the latest stages when you’re dealing with enterprise-scale analytics.
Product Development Phase
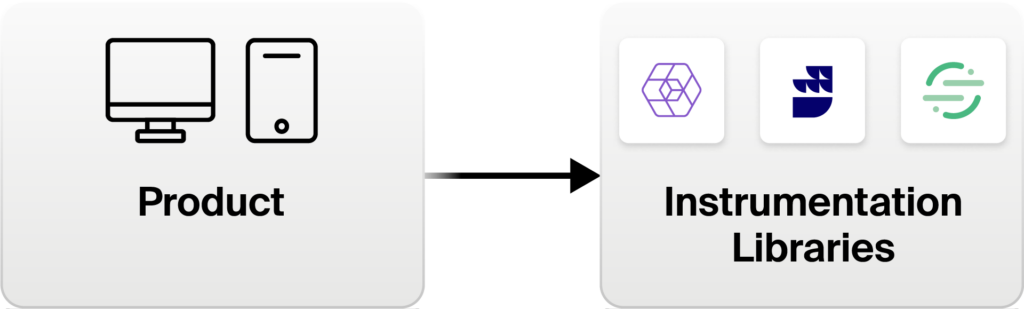
In the pre-customer, product development phase, it’s natural not to think about analytics. After all, you don’t have data to analyze yet. However, as you develop the product, always keep product telemetry / instrumentation in mind (e.g. Snowplow, Rudderstack, or Segment). This will be critical for getting insights on how your product is being used and adopted, and assessing whether you’ve achieved product-market fit. Think ahead about how you want to organize the components of your application and the associated data you’ll be collecting to avoid having to add instrumentation repeatedly. Your instrumentation may be very limited at this stage, but include it in all design discussions and get it into the developer DNA.
Customer Acquisition Phase
Now that your product is in the alpha or beta stage, design partners and trial customers begin flowing in. You’ve launched your website and have started building out content to support the customer journey. You have many lead sources, including ads, emails, webinars, and more, but which are driving the most free trial sign ups on your website? Which pieces of content are delivering the most impact?
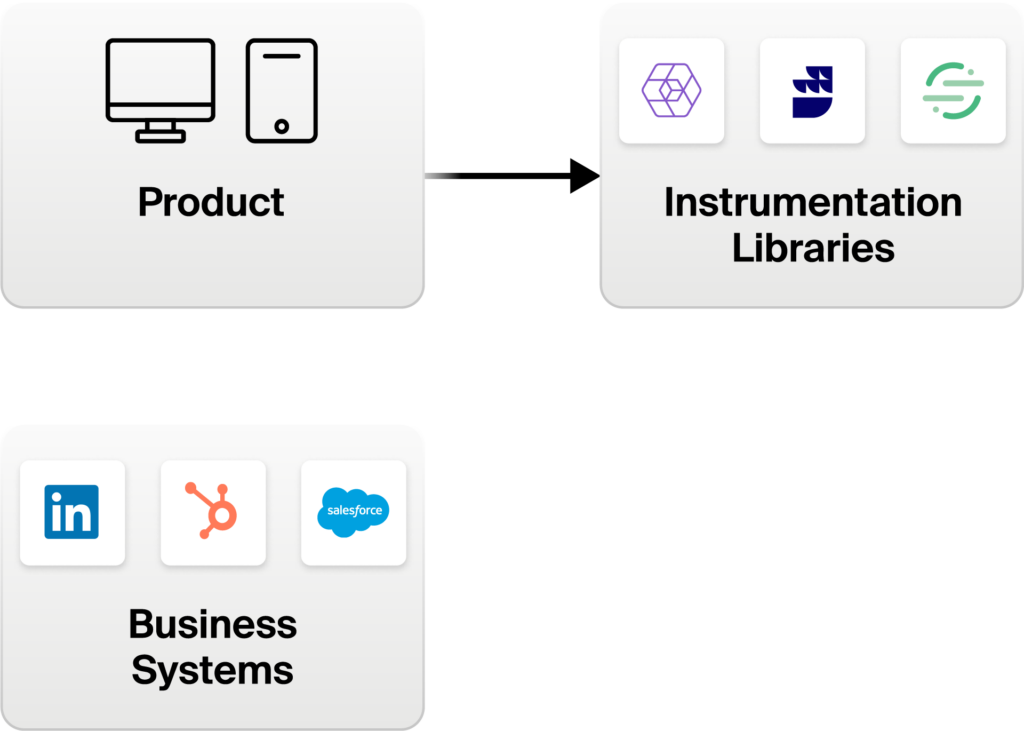
In this phase, it is critical to be data-driven. You can begin measuring the effectiveness of your marketing investments by leveraging the built-in analytics capabilities of your point marketing solutions (e.g. Google Analytics, LinkedIn Ads, Outreach, HubSpot, Salesforce). Eventually you’ll need to stitch all this data together for a complete view of the customer journey. This is only to get harder, especially as your stack balloons from 10 to 100, like in many large enterprises. If you have the resources, now might be a good time to think about a customer data strategy, and perhaps a single source of truth in a data warehouse.
Early Customer Adoption Phase
You’ve officially launched your product. There’s a meaningful number of customers starting to use it, and you’re learning what’s working and what’s not. As you gather data, you rapidly iterate on product features based on those insights. In this phase, most product feedback comes through direct communication with the early customers that are most accessible. However, you need to start building the structure for integrated, scalable analytics:
- Finalize your product instrumentation strategy. The modern approach to instrumentation is to use an instrumentation library that is decoupled from any analytics tool and unopinionated. Vendors like Segment, RudderStack, and Snowplow offer best-in-class instrumentation libraries covering mobile, web and backend. Most importantly, they don’t force you into any vendor-specific data model. You can collect data in open formats that any analytics tool can consume.
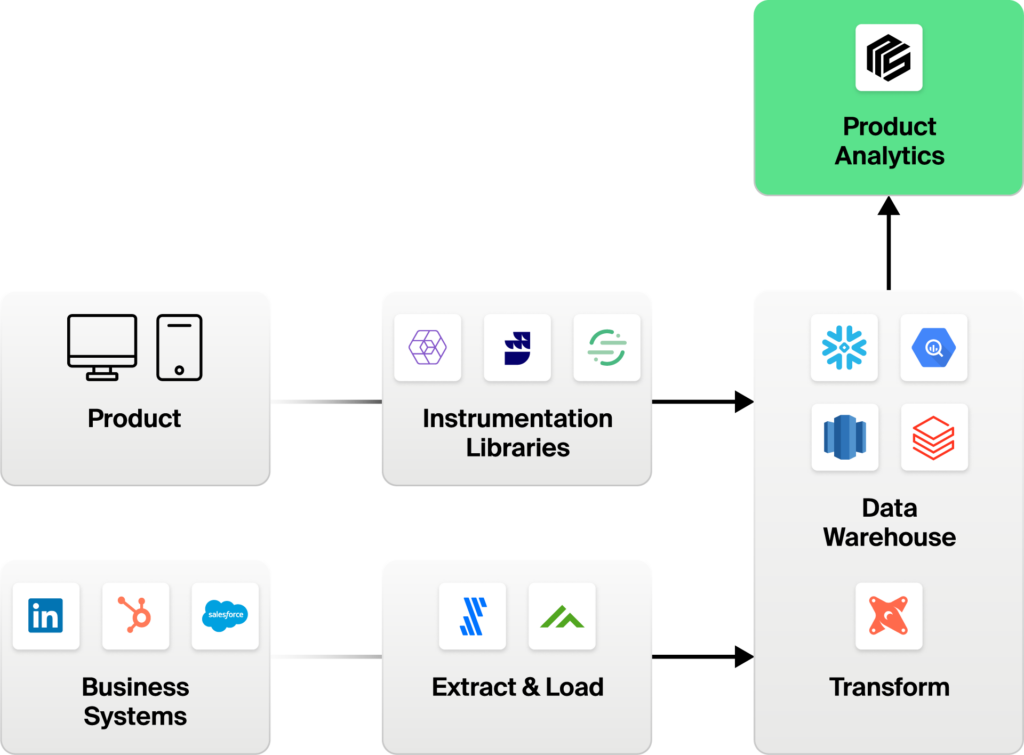
- Set up a cloud data warehouse. This may seem premature. Typically, companies set up warehouses much later in their lifecycle. But with modern cloud data warehouses like Snowflake, it’s become easy to spin up a warehouse and manage it with very little effort. With its elasticity, auto-shutoff, and pay-per-use models, it’s also more affordable for even an early-stage startup. You can run a warehouse for a few hundred dollars a month given the small amount of data at this stage.
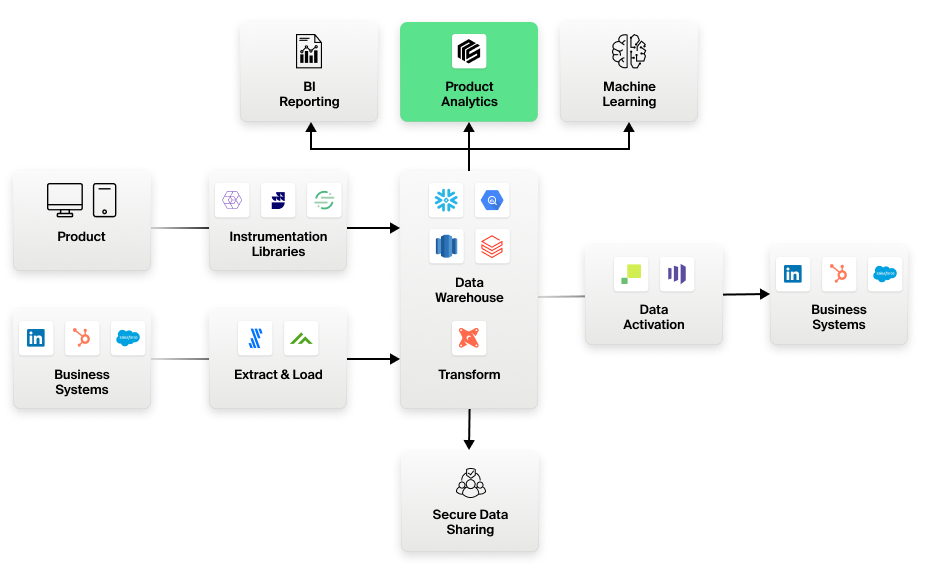
Data warehouses are becoming the center of gravity of all enterprise data. The warehouse will be the core of any analytics initiative you might undertake. The instrumentation libraries mentioned above provide out-of-the-box ways to easily land data into the data warehouse. For non-product data, use a modern ELT tool like Fivetran or Matillion to move data from your marketing and sales systems into your data warehouse. These ELT tools provide a rich library of connectors to most business systems and are also purpose-built for the modern cloud warehouse. For any transformations of data within the warehouse, use a data transformation tool like DBT.
- Put in place a product analytics tool. Looking towards the future, an effective product analytics tool will work natively on a data warehouse. Avoid having your data siloed in an analytics vendor’s black-box SaaS service. While this may not seem important early on, it can quickly snowball into unmanageable data quality and poor analytics visibility as you grow. You can soon end up with multiple ETL and reverse ETL pipelines, discrepancy of metrics across teams due to multiple sources of truth, and high costs managing multiple analytics tools.
Another thing to consider is whether your product analytics tool can fulfill your analytics needs without requiring a BI tool in addition to it. Make sure the product analytics tool you pick can analyze all the data in your warehouse. You want to be able to combine product instrumentation data with data from your business systems to get a 360-degree view of your customer journey.
At this stage you may not have much data. Your instrumentation may still be evolving. You may not yet have data flowing in from all your business systems. That’s ok. The key is to get started with analytics and establish the framework. Showing value of even basic analytics encourages engineering to add more instrumentation (instrumentation often being a low priority for engineering). More importantly, it is creating a culture of data-driven decision making across all functions in the company. Companies that set an analytics foundation early on increase their odds of success dramatically; and they can save millions of dollars in re-architecting their stack for analytics later down the road.
Growth Phase
You have established product-market fit. Your customer base is growing. Your product has a large footprint with many feature sets. In this phase your analytics strategy includes:
- Making analytics the center of all your decision making. In a company that does this right, every product or customer discussion will start by pulling up a dashboard of analytics insights. Your entire company should align on a single tool for all analytics. Ask all functional heads to build and show business metrics related to their function in this tool. They should be able to understand drivers for these metrics within the same tool. They should be able to easily test hypotheses around factors influencing these metrics. With the foundation you have put in place, you will have:
- a single source of truth for all your metrics — no more conflicting values for metrics such as the number of active users, conversion rate, customer lifetime value, customer acquisition cost, etc.
- cross-cutting analytics, with each function being able to relate their analytics to adjacent functions. For example, a growth marketer would be able to correlate campaign channels to activation and engagement in product. A customer success manager would be able to understand correlation between product usage, account profiles, and upgrades.
- Formalizing a data engineering team. You may already have a couple people focused on data engineering, likely associated with marketing, product, or engineering. This is the time to centralize a data engineering team that owns the data warehouse, instrumentation systems, ELT tools/jobs, and analytics tools. This team ensures that data operations run smoothly, that data is properly secured, and that business users have governed access to data. This team may also include data scientists who put in place a machine learning (ML) tool.
Note that each business function should be able to self-serve for analytics without having to rely on the data engineering team – the analytics tool you pick should facilitate that. Rather than getting bogged down by repeated requests for reports from business, the data engineering team should work on high-value analytics and make sure that the data being accessed by the business is the right data.
Expansion Phase
You are a well-known player in your space. You focus on expanding to newer industries, newer product lines, international markets, etc. You have an ecosystem of suppliers, partners, resellers, system integrators, and others. Perhaps you are thinking of an IPO. In this phase you need to:
- Add a business intelligence (BI) reporting tool. Pick a BI tool for production reporting. Look for a tool that provides the kinds of reporting you need: financial reports, specialized visualizations, scheduled distribution of reports, export/print capabilities, and embedding into partner systems. Ensure that the BI tool you pick can work directly off your data warehouse.
- Facilitate data sharing and activation. Your product analytics tool can help you build and generate logical views of your data in your data warehouse, for use by your data sharing and activation tool – this removes the need for data duplication. You can then use the data sharing capabilities of your warehouse to securely share relevant parts of your data within your ecosystem. Data activation tools can also move data from your warehouse to a select business system for specific actions, such as pushing a cohort of users to Marketo for a marketing campaign.
Conclusion
By planning ahead and centralizing your analytics architecture – around your data warehouse, you’ll maintain the greatest flexibility for storing, analyzing, and activating your data.
NetSpring offers a next-generation product analytics tool that works natively on top of your data warehouse. NetSpring helps teams generate insights from across their sources of data using the power of BI. Contact us today to get a live demo.


