First-generation product analytics tools such as Mixpanel and Amplitude include a custom data platform under the hood for storing and analyzing product instrumentation data. These platforms claim to be specially optimized for product analytics usage patterns, however, they severely limit the user’s ability to do ad-hoc exploration due to rigid modeling, limited querying capabilities, and missing context – challenges we described in a previous blog.
As someone who has architected multiple databases and analytics engines serving millions of users (see Additional Resources at the end of this blog for a few of my talks), I firmly believe that:
The modern cloud data warehouse can serve product analytics workloads as efficiently as any other system, without creating data silos or sacrificing the generality of SQL.
In this post, I will list the critical technical requirements for a product analytics application and detail why data warehouses are perfectly equipped to address those challenges.
Product Analytics – An Extremely Brief Technical Overview
Before I present my arguments, let’s go over a brief refresher on product analytics.
Product analytics is analytics on product usage and performance data. Product usage data includes user actions like clicks, keystrokes, and application events like page loads, API errors, slow requests, etc. This data is also called event data. Event data is most commonly captured in semi-structured format and pushed to the analytics platform for further processing and analysis.
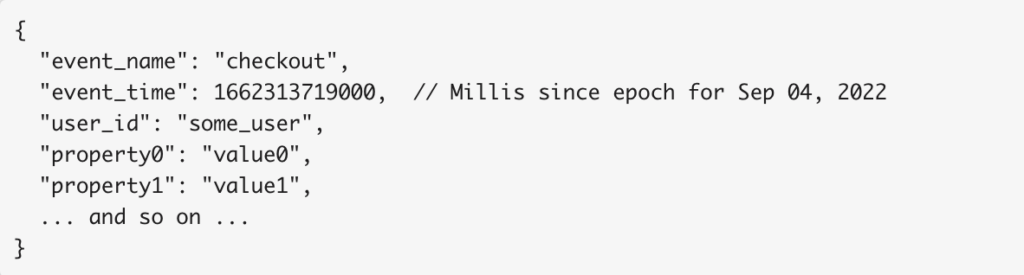
There are three fundamental properties present in some form in all events:
- event_name – Name of the event or user action
- event_time – Point in time when the event occurred
- user_id – Id of the user that initiated the event
Event time strings together all events by a user to provide a global ordering across all sources for that user. Product analytics tools aggregate and visualize this stream of user actions ordered by event_time to understand behavior, engagement, attribution, drivers, etc.
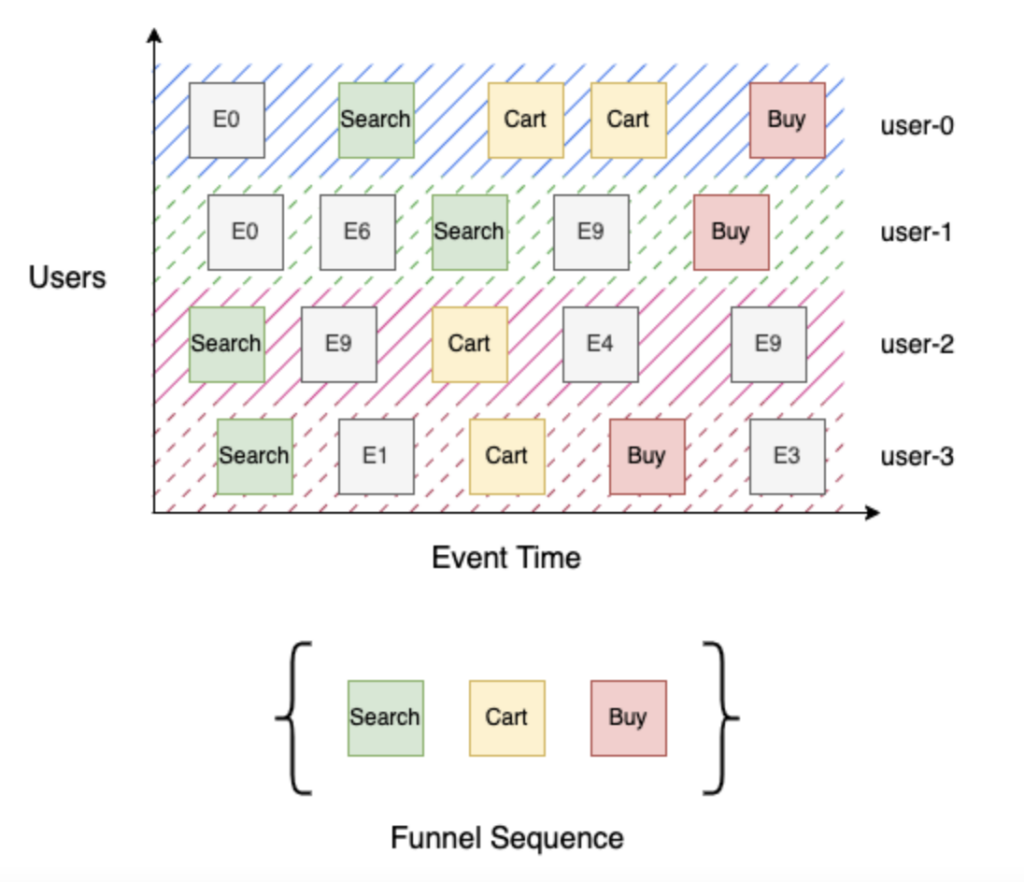
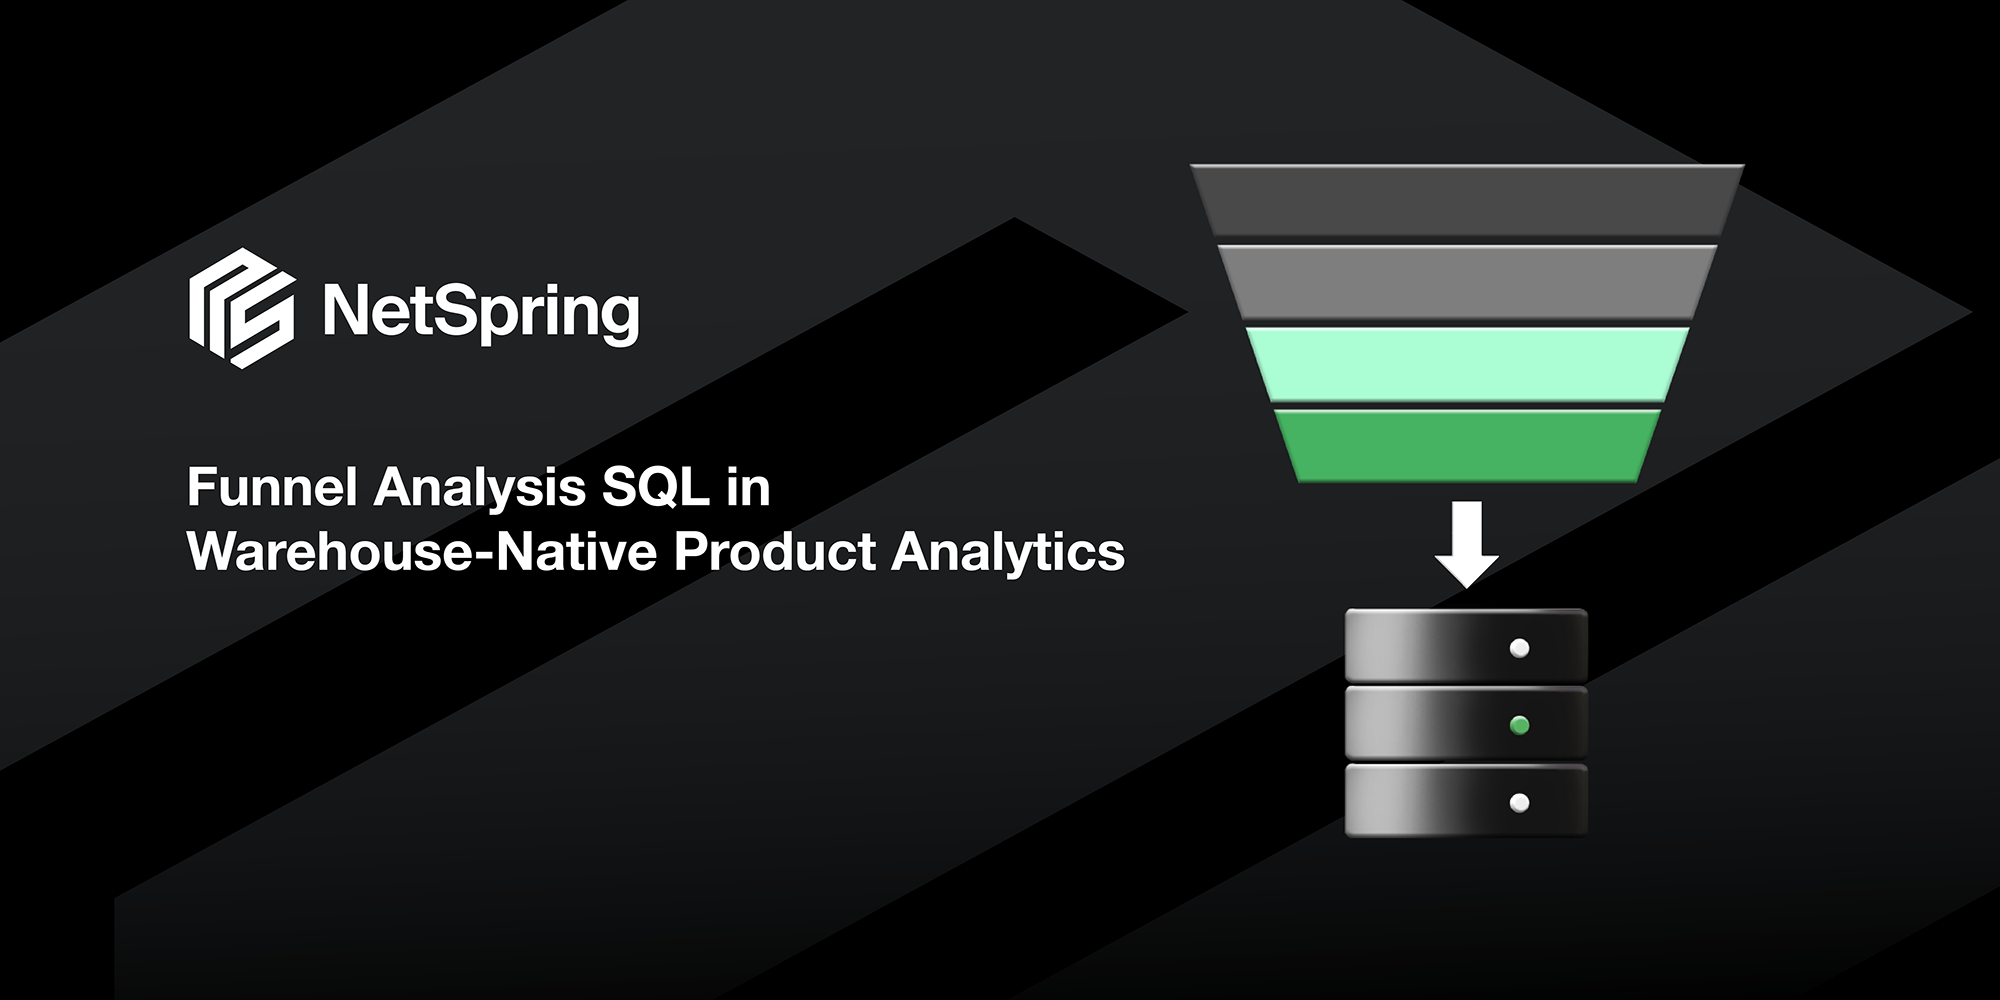
Let us consider a simple 3-stage buying funnel with stages – Search, Cart, and Buy. Search (stage 1) identifies all users that searched for the product, Cart (stage 2) identifies all users that searched for a product and added it to the cart, and finally, Buy (stage 3) identifies all users that searched for a product, added it to their cart, and checked out. Building this funnel is straightforward given a sorted stream of user events by event time – for each user, iterate through the sequence of events to track their progress through the funnel, then aggregate distinct users by stage. In the example above, “user-0” & “user-3” made it to Buy (stage 3), and “user-1” reached Search (stage 1) since there is no cart event in their event stream, and “user-2” reached Cart (stage 2).
What Makes Product Analytics Hard?
Extreme Scale
Product usage data can be extremely voluminous. It is generated with each user interaction with the product and is usually denormalized and extremely rich with contextual attributes. Plus, this data grows over time with increasing product usage. Just imagine the number of daily interactions (clicks, taps, keystrokes, etc.) you have with your favorite product, and then multiply it by the number of users using it! This large-scale data needs to be stored and retrieved efficiently for sub-second analysis.
Event Sequence Queries
Product analytics computations are significantly more complex in general than traditional slice and dice queries typical of business intelligence tools like Tableau and Looker. As explained in the primer above, computations require following a sequence of events to understand user behavior. The system needs to be efficient at this combination of high complexity and scale. Interactive performance is critical for any self-serve product analytics solution to enable the end user to explore the data and arrive at valuable insights quickly.
Real-Time Ingestion
Product teams need quick visibility into product usage data to afford rapid iteration on product features, especially around launches or to support experiments. Product usage data is generated continuously and is expected to be available for analysis within minutes. Often, the bulk of the data may be produced in short bursts aligned with external events or the time of the day. The system needs to durably ingest this timestamped event data quickly and organize and index it on persistent storage to enable efficient real-time querying.
Continuously Evolving Schema
Product Usage data can be annotated with context-specific attributes to aid analytics. These annotations need not be declared upfront but added on a need basis with changing requirements. For example, the users may decide to annotate the buy event in the funnel example with the total price and only include events that have a total price of more than $5. Said simply, event data doesn’t have a pre-defined structure or schema and evolves continuously with changing product requirements.
Data Warehouse To The Rescue
Engineering a product analytics platform is undoubtedly a tough systems problem. Fortunately, the database research community has been actively working on the problem areas listed above for decades.
Modern data warehouses use various cutting-edge techniques to deliver cost-effective performance at scale for product analytics.
In this section, I’ll list a few key design details for data warehouses that address the above challenges.
Columnar Storage: Unlike row-major storage formats, columnar storage minimizes the number of bytes touched by a query by only accessing data for required columns. Analytical databases have been experimenting with columnar storage as early as the 1970s. The “C-Store” paper by Stonebreaker et al., 2005 demonstrated considerable performance improvements for analytical workloads. All analytical systems today use columnar storage for improved performance.
Efficient Compression for time-series data: A variety of techniques have been developed over time for data compression in Databases to reduce cost and improve performance. Besides implementing all the well-known basic algorithms like dictionary encoding, RLE and LZW variants, Delta encoding, etc. warehouses continuously invest in this area to bring innovation – Google published the Capacitor format that describes column ordering for better compression ratio, Gorilla paper by Pelkonen et al., 2015 from Facebook describes a compression scheme for time-series data. Most of these techniques are employed by all major data warehouse vendors today.
Massively Parallel Processing: Distributed databases distribute processing across a bank of compute nodes, where processing happens in parallel and output from each node is finally assembled to produce a final result set. Goetz Graffe, in his “Volcano” paper, proposed models to parallelize work in SQL execution engines across threads and nodes. Systems such as Teradata and Netezza pioneered the approach to parallelize as much work as possible as early as possible and popularized the term MPP. Today, mature databases process terabytes of data in seconds using this architecture.
Clustered Data Layout: Clustered index has been used in databases for a very long time to speed up various relational operations like – sort, aggregate, join, etc. This is especially useful for event sequence analysis to speed up queries by keeping event data pre-sorted in event time order. Most major data warehouses, including Snowflake (data clustering), BigQuery (clustered tables), Redshift (sort key), and SQL Server (clustered and nonclustered indexes) allow custom clustering for tuning performance.
Vectorization or JIT: Database implementations are heavily optimized and strive to achieve performance close to custom hand-written programs for each query. There are two widely known techniques that enable such performance – Vectorization pioneered by Vectorwise and JIT code generation pioneered by HyPer. Both ideas are extensively researched, with most modern implementations using some ideas from both paradigms (see Additional Resources below for my talk in this area).
Window Function for Event Sequences: Added to SQL in 2003, Window Functions (or Analytic Functions) enable most query patterns on time series data that require access to neighboring rows. Since then, the use of this operator has become pervasive in all data warehouses resulting in a lot of research and optimization in its implementation – e.g. “Efficient Processing of Window Functions” by Leis et al., 2015 and “Incremental Computation of Common Windowed Holistic Aggregates” by Wesley et al., 2016. Product analytic tools can make extensive use of window functions for querying event sequences. This is an area that is ripe for innovation. I will cover more details in subsequent posts.
Semi-structured types: Annotated with context-specific attributes which need not be declared upfront but added on a need basis with changing requirements. For example, the end user may decide to annotate the Buy event in the funnel example above with the purchase price and only include events that have a price of more than $5. Event data doesn’t have a pre-defined structure or schema. It evolves continuously with changing requirements. In 2010, Google published the “Dremel” paper that described a storage format for interactive ad-hoc on nested semi-structured data. This paper became the foundation for the well-known Apache Drill project. Today, all major cloud data warehouses use ideas in this paper to support continuously changing JSON and similar nested types with a minimum performance penalty.
Real-time Processing and Ingest: Systems like Druid and Pinot popularized real-time ingestion recently using the Lambda architecture. The Kappa architecture as used by Flink and Spark, further simplified streaming ingestion and has been embraced by most modern data warehouses – BigQuery has a streaming Storage Write API that can ingest at high throughput (~10 GB/sec) with freshness latency of 2-3 mins. Similarly, Redshift integrates with Amazon Kinesis Data Firehose to ingest and make the firehose of data live in under a minute. Snowpipe manages continuous data ingestion into Snowflake with data freshness of a couple of minutes for high throughput scenarios.
Conclusion
Cloud data warehouses have not only arrived but exploded in the last decade. It may have made sense to create a custom platform in 2010 when Mixpanel and Amplitude were founded, but that architecture is outdated today.
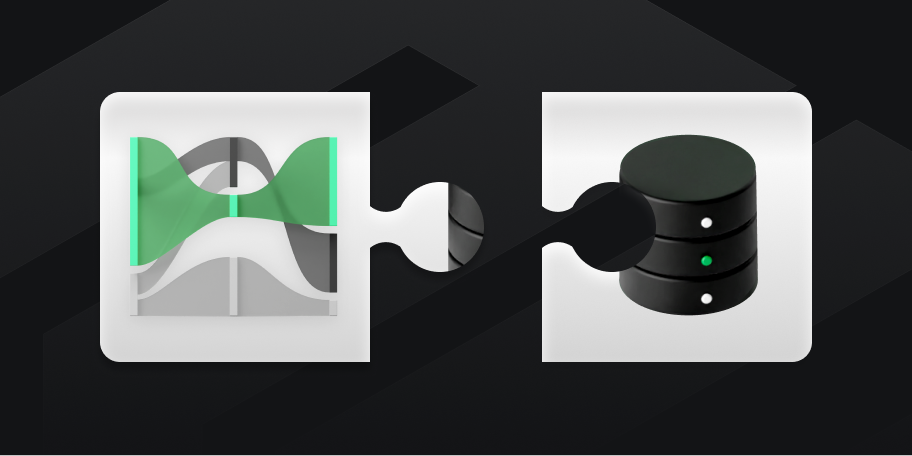
At NetSpring, we believe that using a data warehouse for running product analytics queries is not only performant and cost-effective but also unlocks new kinds of analyses that aren’t possible in existing product analytics tools like – enriching user event data with the business context in salesforce, combining multiple event sources to better understand product usage, etc.
NetSpring can connect to all major cloud data warehouse vendors, including Snowflake®, Google BigQuery™, Amazon Redshift, and Databricks, to provide a world-class product analytics experience by using best-in-breed solutions for each workflow.
Contact us to get a live demo today.
Additional Resources:
- Pragmatic Code Generation for Efficient Execution (Satyam Shekhar on YouTube)
- Speed at Scale How Analytics Performance Makes Everything Possible (Satyam Skekhar on YouTube)