“Real-time” might be one of the most ubiquitous terms in business today, describing systems and features that respond to events live as they happen. With so many people interacting, shopping, and consuming content in real-time, businesses want analytics that help them understand these behaviors and make decisions in real-time, too. Armed with timely, actionable insights from fresh data, the people, processes, and systems in an organization are able to react to events at the speed expected by their customers — and faster than the competition.
For business agility, real-time analytics couldn’t be more important. However, varying business requirements coming from across industries has created some confusion over this term. In this article, we’ll clarify the term by giving you a framework for thinking about what real-analytics should mean to your organization.
What is real-time analytics?
Gartner defines real-time analytics as “the discipline that applies logic and mathematics to data to provide insights for making better decisions quickly.” Within this category, there are two types: on-demand real-time analytics, where analytics are delivered quickly once they’re requested by users, and continuous real-time analytics, which proactively alerts users and triggers responses to events.
A common misconception is that analytics are only “real-time” if the system operates at a certain speed — such as sub-second responses to events. In fact, there’s no consistent definition for how fast you need to be in order to be considered “real-time.” If you’re interested in building real-time analytics, it’s best not to focus solely on the numbers, and instead to think about the characteristics that your system will need to have.
What are the characteristics of a real-time analytics system?
The definition from Gartner is useful, but from a business perspective, it can be hard to picture what a real-time analytics system looks like concretely. To help, we’ve identified six characteristics that any real-time analytics system should have:
- Data freshness
- High-performance dashboards
- “Speed of thought” querying
- Live monitoring
- Alerting
- Instant actions
You can use these characteristics as a framework for thinking about what real-time means to you and your role in the organization. In each of the sections below, we’ve defined the characteristic, along with a note about how it works using modern data technologies.
Data Freshness

Conventional data processing methods have a lag time between the collection of data and the analytical operations that eventually yield actionable insights. Data for analytics typically goes through pipelines for extraction, cleansing, and normalization. Then, it’s loaded into specialized analytic stores. In many enterprises, the total time between web data is collected and when it’s available for analytics is 24 hours or more.
Real-time analytics means you have fresher data at your fingertips — data was created minutes or seconds ago, not hours ago.
How it works:
Increasingly, more and more data is being processed continuously in streaming fashion with systems like Kafka. Cloud data lakes enable efficient storing and processing of all raw data. Finally, the emerging ecosystem of query processing tools directly on top of the data lake eliminates the need for data movement across multiple systems.
High-Performance Dashboards

Dashboards are a critical part of any organization’s analytics stack, and slow performance has been a challenge, leaving users waiting for queries to be completed and data rendered.
To achieve real-time analytics, it’s critical that data engineers constantly strive to optimize dashboard performance for faster rendering.
How it works:
Depending on how the dashboard is implemented, better performance could be achieved by modern cloud query processing systems, pre-computed cubes serving specific dashboards, in-memory databases, or indexed systems.
“Speed of Thought” Querying

A typical pattern of ad hoc analytics involves slicing and dicing data by various dimensions interactively, either by using SQL or a visual exploration tool. When working with a large amount of data and complex schemas, it’s common to need to wait for the system to catch up so you can ask your next question.
Good interactive query performance is key to real-time analytics because it lets analysts explore data at the “speed of thought.”
How it works:
Many of the techniques that enable faster dashboards can also enable faster interactive querying. Additionally, systems that offer an integrated application and data platform can optimize query performance through familiarity with the application’s metadata model.
To avoid running into questions that can’t be answered with the data at hand, it’s essential that the query processing engine can join and query across live streaming data and static batch data with full SQL support. Note: this is different from processing a stream of data, writing it to a database, and then issuing batch queries to the database.
Live Monitoring

Real-time analytics systems support continuous, live monitoring of key business metrics. Operators and analysts need to be able to see these metrics updating as the underlying data changes, rather than waiting for a batch process to run.
How it works:
Live monitoring requires efficient computation on the backend. The system needs to be able to update metrics incrementally, calculating the minimum re-computation needed based on just the data that has changed since the last computation. Furthermore, the system needs to be able to push updates continuously, rather than relying on the traditional pull model that waits for a user query.
Alerting

In fast-paced operational environments, users are not constantly looking at reports or dashboards to detect anomalies in business health. Real-time analytics systems need to have a robust alerting mechanism that notifies users immediately of potential problems and opportunities. Anyone should be able to set up an alert, not just an analytics expert.
How it works:
Alerting systems with no-code rules can help make business logic easily expressed by business users. Furthermore, machine learning models can be trained to detect anomalous data.
Instant Actions

In time-critical business environments, receiving an alert about a potential issue or opportunity is only partly useful. How do you then act on it?
For real-time analytics, closing the loop with automated or semi-automated actions is critical. Those actions could be as simple as posting a message on a collaboration tool, or specialized API calls to initiate certain business workflows or processes.
How it works:
Similar to the alerts, actions can be specified with no-code rules by a system that models business workflows and processes under the hood. With machine learning models, actions can even be learned and then automated in the future.
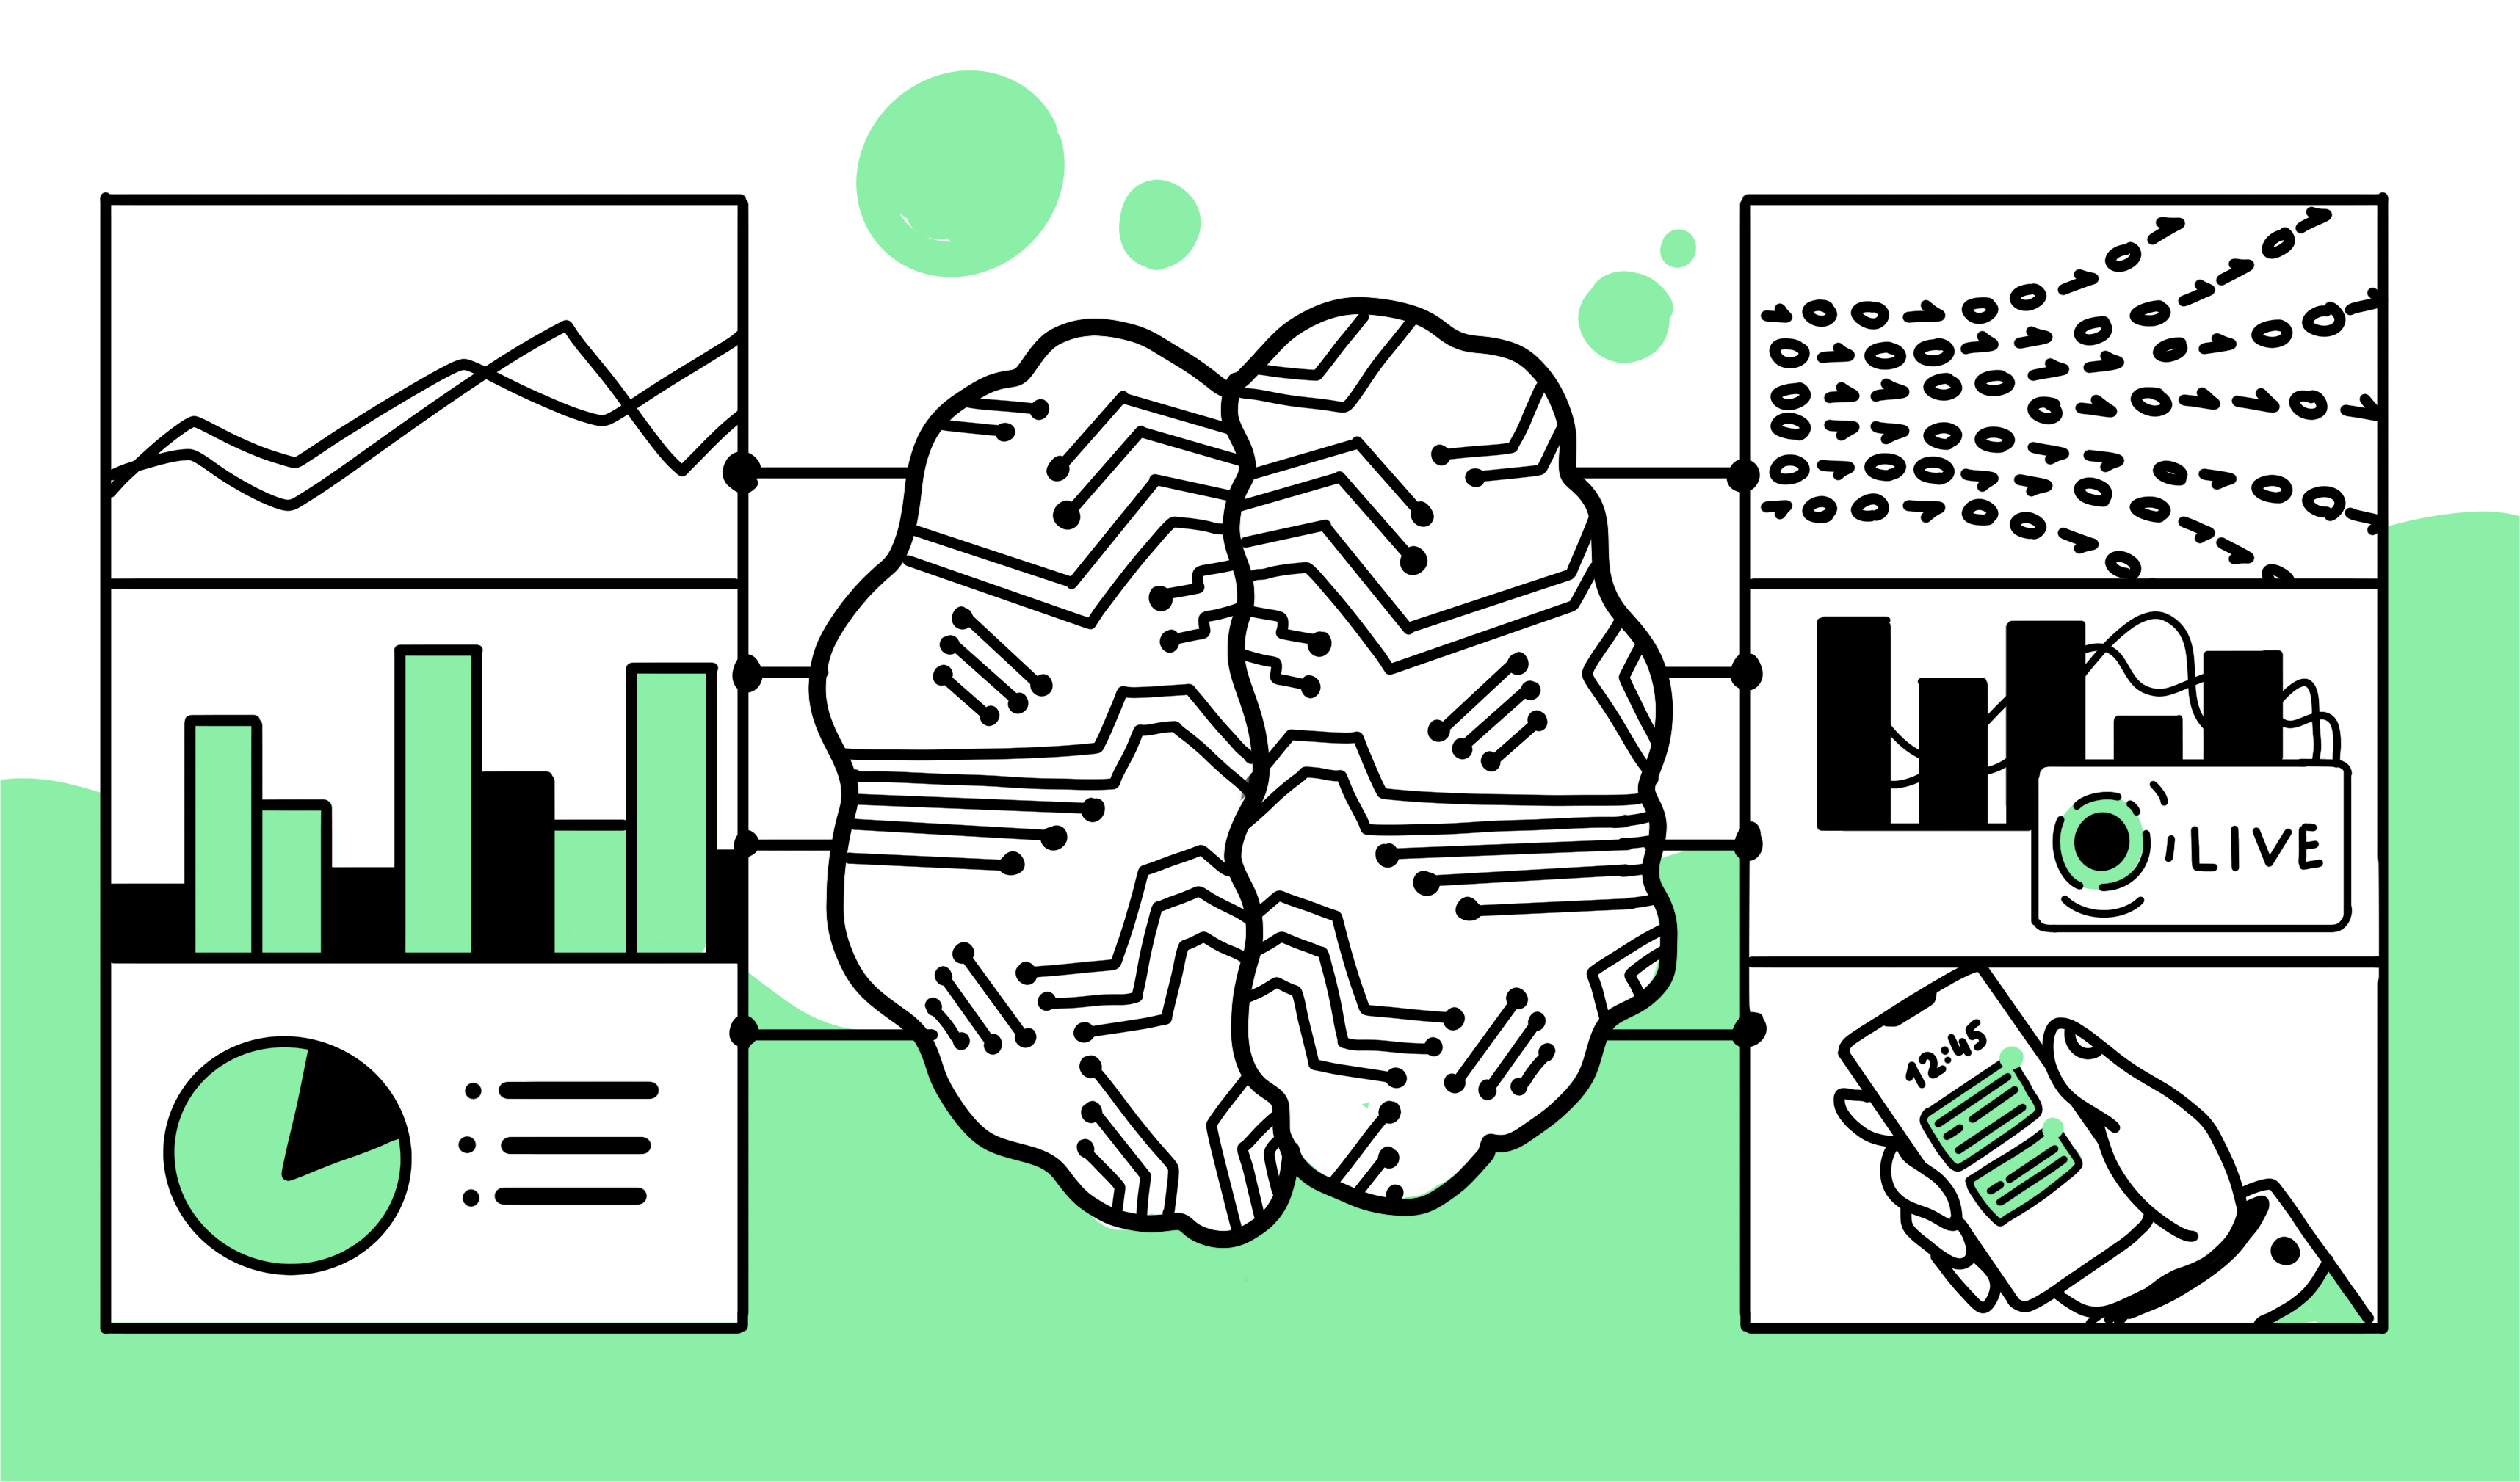
The power of one central platform for real-time analytics
To build towards real-time analytics, most businesses follow a piecemeal path: enabling different parts of their stack with a range of tools that can fulfill some of the characteristics in this framework. While this provides flexibility and lets you take on the change gradually, there’s another way that’s becoming increasingly popular: adopting new platform technologies that can do it all.
Rather than bringing real-time capabilities to just one part of your analytics stack, new event stream analytics platforms consolidate real-time analytics with traditional BI to ensure data freshness across your entire stack. They provide high-performance dashboards, interactive querying, and live monitoring that unifies data-in-motion and data-at-rest. These platforms can include ML models for alerting and actions.
NetSpring’s next-generation platform can empower your business with a modern, cloud-native, end-to-end solution, purpose-built for event data analytics in real-time and at scale. Learn more about NetSpring’s solutions here, or contact us to get a live demo.