Have you spent time and effort onboarding multiple teams, vendors, and technologies as you’ve grown your product analytics stack? If so, you know that this can often create data silos and a host of other issues, from data duplication to process inefficiencies. It doesn’t have to be this way. In this article, we’ll cover the three phases companies have typically been going through in their product analytics journey, and how next-generation product analytics can replace multiple tools with a single analytics platform built on the modern data stack.
The three phases of product analytics maturity
Organizations tend to start with a basic analytics tool to answer simple questions about what users are doing in the product. It’s not long before things get more complex and a team has different tools for every kind of question. Does this analytics journey sound familiar to your organization?
Phase 1: Tracking user interactions
You start with a fundamental question: How are users using your product? You pick a tool such as Mixpanel. Next, you get engineering to add some instrumentation. It takes some convincing to get the security team’s approval to send product instrumentation data into a black box SaaS tool, but eventually you succeed.
Having done the legwork, you start getting the first level of insights. Your analytics tool lets you do event segmentation to see what users are doing. You can measure conversion, engagement, and retention-related metrics. The tool supports building basic funnels and paths, too. You now have a level of visibility that you did not have before.
Phase 2: Identifying drivers of business outcomes
Your original analytics tool worked fine until you naturally started asking the next set of questions. This next level of analytics goes beyond just measuring outcomes. It is about understanding drivers of business outcomes, e.g. Why are some cohorts converting better than others? How do onboarding journeys impact activation? What is the profile of users who churn? How do product metrics relate to overall business metrics?
When your first analytics tool falls short in answering these questions, you turn to your BI or Data Engineering team. This team sets up ETL jobs to export data out of the product analytics tool into a data warehouse. They use a BI tool like Tableau to generate specific reports that you ask for. They struggle to generate these specialized reports because writing funnel/path-type product analytics queries are very difficult to do in Tableau. It takes an average of 2 weeks to get back a single report. Often, it’s too late to act on any insights from these reports. The BI and Data Engineering teams are overwhelmed with repeated requests from the business.
Phase 3: Supporting custom analyses with SQL
As your analytics needs scale, it becomes very difficult to depend on the BI or Data Engineering team. Not only does it take too long to get the reports you need, the analytics is siloed and not seamless. You are unable to use the results from the BI tool in further analysis in your product analytics tool and vice versa. For example, you want to study account-level behaviors of users, which requires data from a sales system. Using the results from a BI report, you want to study conversion funnels filtered by users that belong to a certain account tier. You cannot do this.
So you decide to hire a business analyst within your business group that is SQL savvy. She buys a SQL tool like Mode, and does SQL-based analysis for the group. It’s faster to generate reports now, since you’re not relying on BI or data engineering. On the other hand, the problem of siloed analytics across multiple tools is just as bad, if not worse, now that SQL is in the mix. The analyst suffers from the challenges of writing and maintaining complex SQL as the analytics needs grow. You are disconnected from the central enterprise data team and start finding discrepancies in metrics across the organization. The central team raised concerns about security and governance with your departmental silo.
Next-generation product analytics
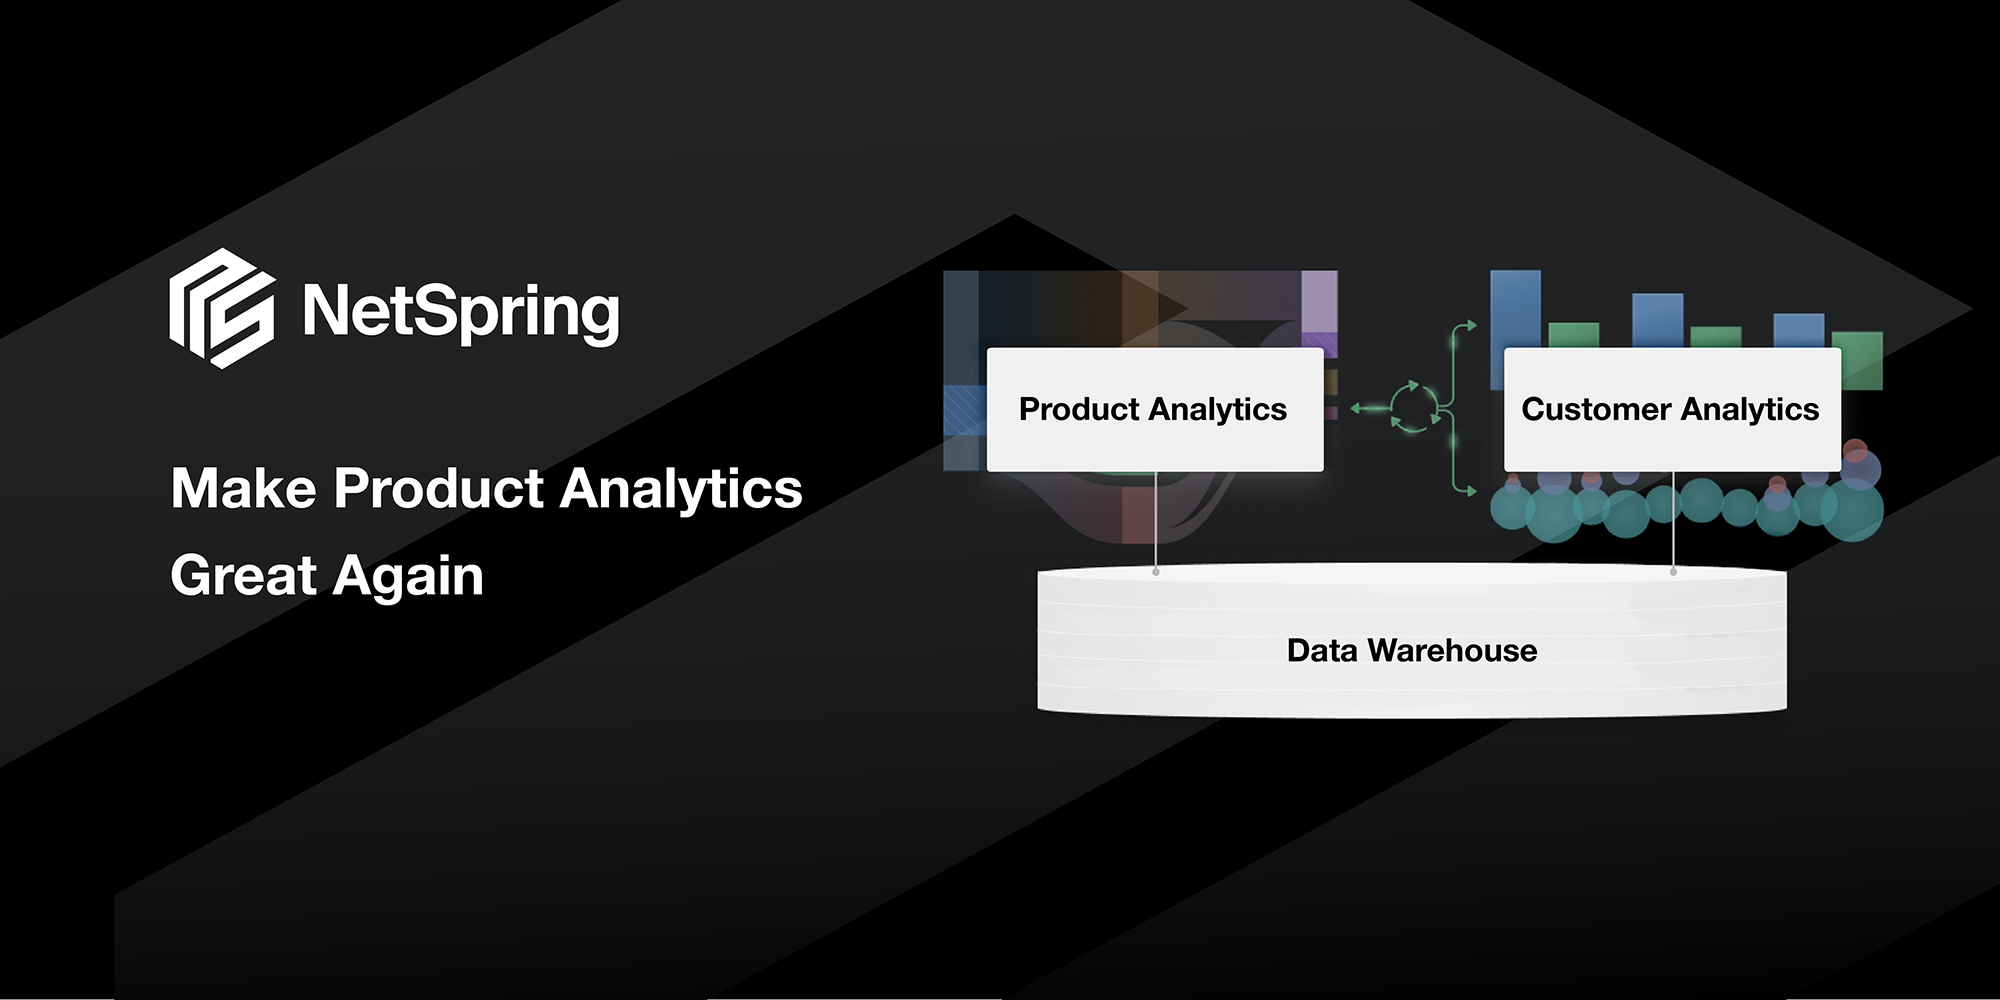
A next-generation approach exists that can do the work of your product analytics software, BI tool, and SQL platform, all in one. It starts by working directly off your data warehouse.
This introduces a number of benefits:
- You can avoid data silos and instead use the data warehouse as the source of truth. In addition to more accurate data, this makes it easier to integrate data from across your business that was previously hard to unify. Privacy and security concerns also become a thing of the past.
- You can leverage the best of product analytics and BI. Basic visibility into product usage remains available, but it’s also easy to answer ad hoc questions with BI-style analytic sophistication.
- Self-service visual interfaces reduce business users’ reliance on BI and data engineering teams.
NetSpring is at the cutting edge of this generational change in product analytics with its analytics product that is built from the ground up for the modern data stack. If you want one tool to replace many, that will grow with your organization, let’s get you started with a live demo!