
In my previous post on customer analytics, we discussed how the singular view provided by customer analytics can replace the fragmented views we’ve had of product, marketing, and operational analytics. A major catalyst for this change is the move to warehouse-native analytics enabled by highly performant data warehouse platforms. This enables us to make the warehouse the source of truth instead of dealing with solution-specific data silos. This change is one of the most important changes in recent history for analytics because it restored the ability to act upon a unified view of our customers, something that we lost as digital products scaled up faster than our warehouses’ ability to support them and we ended up with silos. We can now answer the questions our businesses are really asking rather than having to compartmentalize them because we can’t readily join all of the required data.
While these are exciting developments, the reality is that most of us still have substantial data silos. For all of the promise of the Modern Data Stack, developing a relevant insight and then operationalizing it is slow, difficult, and requires plenty of expensive people. To date, the legacy of the modern data stack is a collection of legitimately impressive point solutions, but an unclear path to what we really want – the ability to use data to activate customers at scale.
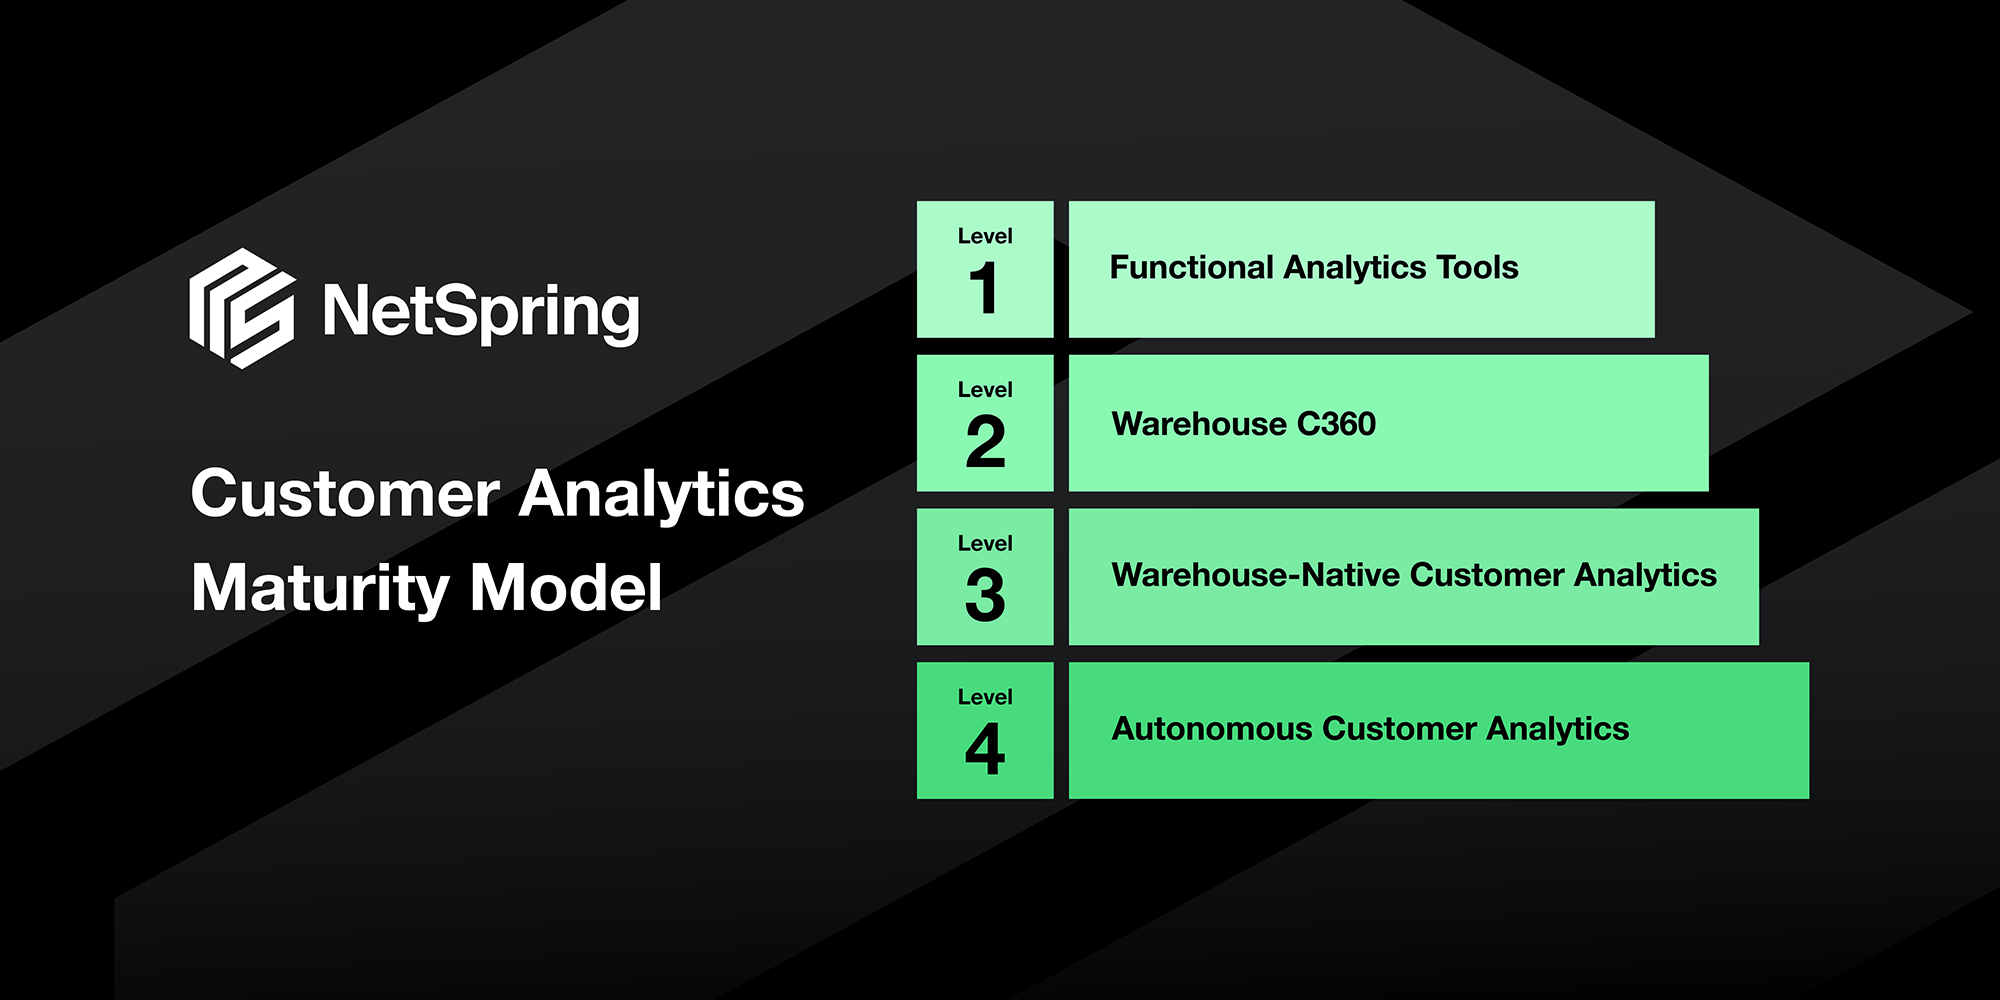
Customer Analytics Maturity Model
As we try to make sense of how these tools fit together, a maturity model is helpful to understand what we’re trying to accomplish and where the different pieces fit in.
![]()
Figure 1: Customer Analytics Maturity Model
Pretty much every business has at least made it in part to Level 1: Functional Analytics Tools and is using some number of functional analytical tools (e.g. Google, Adobe, Amplitude). These tools provide reasonable answers to specific questions (e.g. how many people use feature x, how many people converted from this ad) but make it difficult to answer questions that unlock the bigger picture by spanning across our relationship with the customer (e.g. why are people canceling). These tools maintain their own analytics and their own data in their respective silos, so not only can they not answer more holistic questions, they impede the ability for it to happen elsewhere.
As companies get bigger, they start to invest in data warehouses (e.g. Snowflake, BigQuery, Databricks). Eventually, someone realizes that there is a bunch of data about the same customer coming from different sources – backend product tables, MarTech platforms, customer service platforms, etc. and decides that it should all be unified in a single data structure in the warehouse and perhaps even surfaced operationally in the CDP. This ascent to Level 2: Warehouse C360 seemingly solves the problems of Level 1 – getting a holistic view of the customer – but in practice gets bogged down in two places. First, where the functional tools provide much of the analytics and reporting layer, the C360 is a bespoke solution reliant on internal teams to build everything. Second, while some functional data makes it to the warehouse (e.g. backend product data), plenty of it is trapped in the siloed solutions (e.g. front end product data) and are difficult at best to integrate, leaving the C360 missing material portions of the customer view.
Until recently, Level 2 was the best we could do because the silos of our functional area tools could only be avoided by building our own solutions, and few companies are of a scale that can do this. Now, with solutions like NetSpring it is possible to replace siloed tools with solutions that natively house their data in the warehouse alongside everything else we know about a customer. On top of that, NetSpring is flexible enough to reduce the level of effort associated with building the reporting layer that legacy BI solutions made slow and inefficient to develop. By relaxing the two biggest constraints encountered in Level 2, Level 3: Warehouse-native Customer Analytics maturity becomes possible, and unlocks a host of use cases that lead to faster insights and the ability to use those insights to activate customers.
Reaching Level 3 represents a significant win for most companies because it finally lets them take actions that look at the customer holistically. However, this still requires users to define metrics, attributes and reports that unveil insights and drive decisions. As we look to the future, the next logical step in our maturation is Level 4: Autonomous Customer Analytics, in which we automate much of this discovery, likely through the incorporation of AI to traverse our C360s at scale to unearth potential metrics and dimensions. While such solutions are still largely in the realm of science fiction, with advancements in areas such as Generative AI we are closing in on the ability to deliver these solutions and when they’re ready, they will need exactly the sort of unified view of the customer that we get when we reach Level 3.
Each maturity level represents evolutions in technology that systematically unlock new use cases, with the limitations at each level sparking innovations that are foundational to the next.
| Maturity Level | Use Cases Supported | Limitations | Example Solutions |
| 1: Functional Analytics Tools | Use cases that fit within a functional area such as feature usage, marketing campaign performance, customer contact volume, etc. | Inability to answer cross-functional questions (e.g. why do customers cancel) because data for each functional area are siloed | Product analytics (e.g. Amplitude, Mixpanel), platform-level ad reporting (e.g. Google, Meta) or other sales, marketing and service systems (e.g. Adobe, HubSpot) |
| 2: Warehouse C360 | Unlocks some cross-functional use cases to the extent data is in the warehouse | Incomplete view to the extent any siloed solutions persist; All reporting and analytics must be manually built |
Database layer (e.g. Snowflake, Databricks, BigQuery, Redshift), CDP (e.g. Segment, RudderStack, Snowplow), and BI tools (e.g. Tableau, Looker, Thoughtspot/Mode) |
| 3: Warehouse- Native Customer Analytics | Most cross-functional use cases identified by business | Requires some effort by end users to build out reporting and analytics. End users need to wean off old tools and processes (e.g. BI tools ill-equipped for time series data). | Level 2 stack plus warehouse-native product analytics (e.g. NetSpring) |
| 4: Autonomous Customer Analytics | Level 3 plus use cases that are identified for us by the solution | Heavily reliant on data quality and availability | Currently under development |
Table 1: Maturity Level Use Cases and Limitations of Available Solutions
Conclusion
We are finally arriving at a point where it is clear how the Modern Data Stack can help us achieve our business goals of understanding and better activating our customers. Much of what has been built over the last decade has given us the necessary foundation to mature our approach to customer analytics to the point where we can unlock our most important use cases.
Warehouse-native customer analytics solutions such as NetSpring are the missing ingredient to synthesize a holistic view of our customers that we can leverage at scale. They also set the stage for even more sophisticated approaches that have the potential to automate much of this work away in the future. Regardless, we’ve finally arrived at a place where our data stacks make it straightforward to address our most critical use cases and deliver value for our customers and the business.
To learn more about NetSpring’s warehouse-native Customer Analytics solution, visit the website and request a demo today!
John Humphrey has over two decades of experience helping companies unlock insights and activate data at scale. His experience includes having been the first data hire at Goodreads (acquired by Amazon), leading LegalZoom’s data org through its IPO, and most recently serving as Chief Data Officer at Intuit Mailchimp. John is an advisor at NetSpring.


